Zambia population
1,506,186
Births this year: 0
Births today 0
Deaths this year 44,885
Deaths today 8
1,506,186
| Region Name | Percents | Number |
|---|---|---|
| Protestant | 75.3% | 1,167,956 people |
| Roman Catholic | 20.2% | 313,316 people |
| other | 2.7% | 41,879 people |
| unaffiliated | 1.8% | 27,919 people |
| Ethnic groups Name | Percents | Number |
|---|---|---|
| Bemba | 21% | 325,725 people |
| Tonga | 13.6% | 210,946 people |
| Chewa | 7.4% | 114,779 people |
| Lozi | 5.7% | 88,411 people |
| Nsenga | 5.3% | 82,207 people |
| Tumbuka | 4.4% | 68,247 people |
| Ngoni | 4% | 62,043 people |
| Lala | 3.1% | 48,083 people |
| Kaonde | 2.9% | 44,981 people |
| Namwanga | 2.8% | 43,430 people |
| Lunda (north Western) | 2.6% | 40,328 people |
| Mambwe | 2.5% | 38,777 people |
| Luvale | 2.2% | 34,124 people |
| Lamba | 2.1% | 32,572 people |
| Ushi | 1.9% | 29,470 people |
| Lenje | 1.6% | 24,817 people |
| Bisa | 1.6% | 24,817 people |
| Mbunda | 1.2% | 18,613 people |
| other | 13.8% | 214,048 people |
| unspecified | 0.4% | 6,204 people |
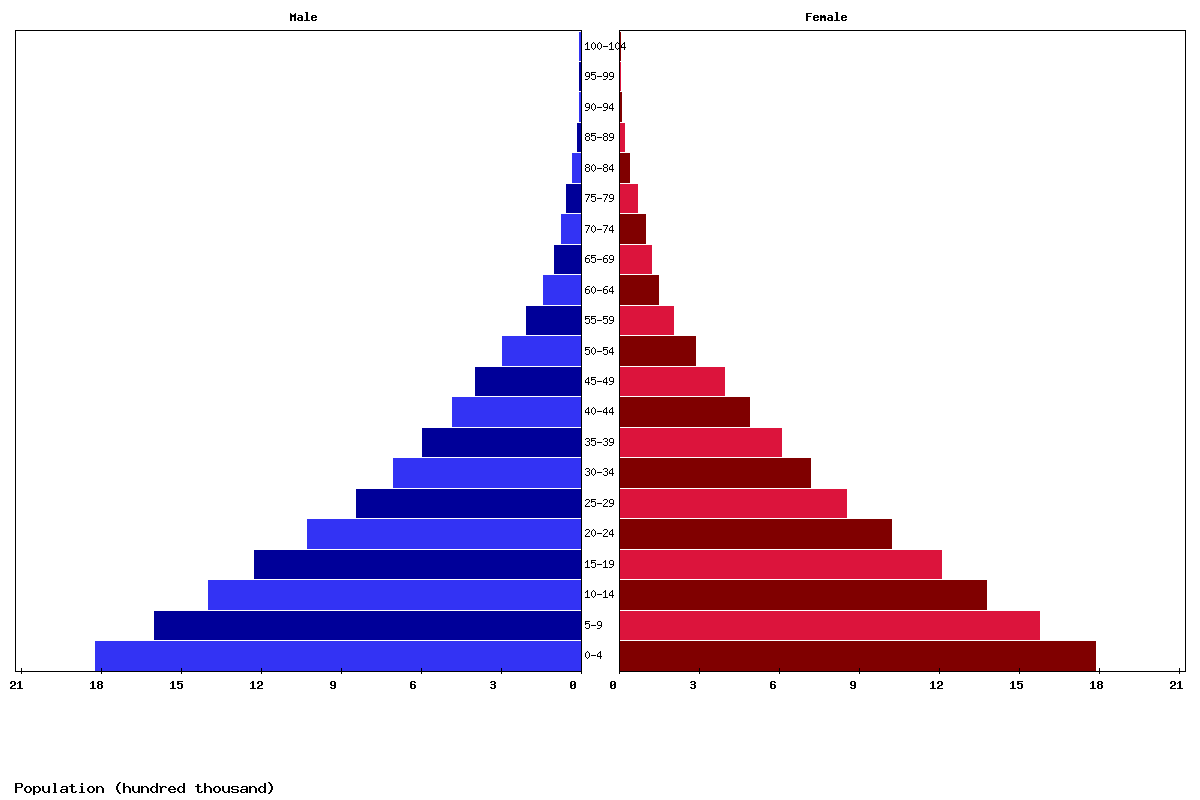
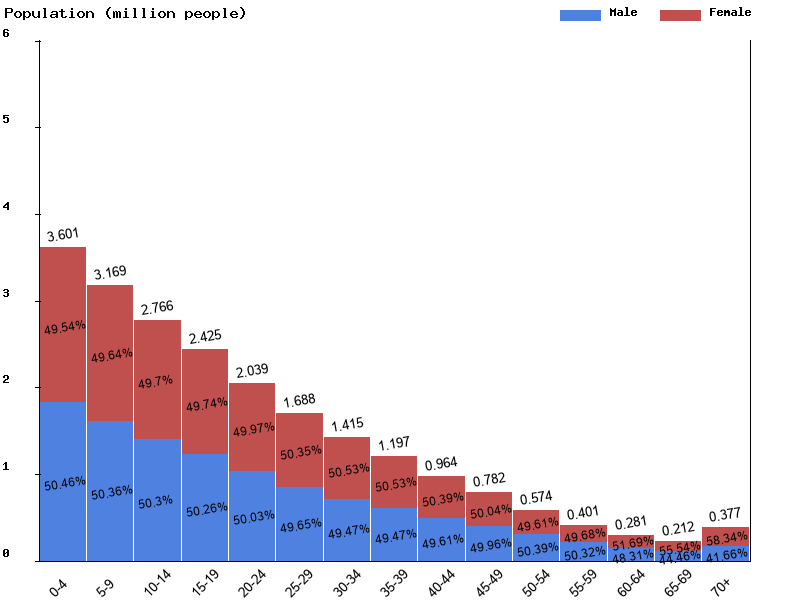
| Age | Both Sexes Population | Male Population | Female Population | Both Sexes (%) | Male (%) | Female (%) | Sex ratio (female/male) |
|---|---|---|---|---|---|---|---|
| Total | 21,892,487 | 10,921,381 | 10,971,106 | 100 | 100 | 100 | 99.5 |
| 00-04 | 3,600,951 | 1,817,139 | 1,783,812 | 16.4 | 16.6 | 16.3 | 101.9 |
| 05-09 | 3,168,966 | 1,595,817 | 1,573,149 | 14.5 | 14.6 | 14.3 | 101.4 |
| 10-14 | 2,765,975 | 1,391,419 | 1,374,556 | 12.6 | 12.7 | 12.5 | 101.2 |
| 15-19 | 2,424,973 | 1,218,895 | 1,206,078 | 11.1 | 11.2 | 11 | 101.1 |
| 20-24 | 2,039,234 | 1,020,177 | 1,019,057 | 9.3 | 9.3 | 9.3 | 100.1 |
| 25-29 | 1,688,236 | 838,260 | 849,976 | 7.7 | 7.7 | 7.7 | 98.6 |
| 30-34 | 1,415,360 | 700,140 | 715,220 | 6.5 | 6.4 | 6.5 | 97.9 |
| 35-39 | 1,196,841 | 592,071 | 604,770 | 5.5 | 5.4 | 5.5 | 97.9 |
| 40-44 | 964,238 | 478,375 | 485,863 | 4.4 | 4.4 | 4.4 | 98.5 |
| 45-49 | 782,495 | 390,918 | 391,577 | 3.6 | 3.6 | 3.6 | 99.8 |
| 50-54 | 574,427 | 289,430 | 284,997 | 2.6 | 2.7 | 2.6 | 101.6 |
| 55-59 | 400,762 | 201,675 | 199,087 | 1.8 | 1.8 | 1.8 | 101.3 |
| 60-64 | 280,922 | 135,721 | 145,201 | 1.3 | 1.2 | 1.3 | 93.5 |
| 65-69 | 211,803 | 94,165 | 117,638 | 1 | 0.9 | 1.1 | 80 |
| 70-74 | 163,949 | 68,327 | 95,622 | 0.7 | 0.6 | 0.9 | 71.5 |
| 75-79 | 116,445 | 48,950 | 67,495 | 0.5 | 0.4 | 0.6 | 72.5 |
| 80-84 | 64,003 | 26,830 | 37,173 | 0.3 | 0.2 | 0.3 | 72.2 |
| 85-89 | 25,416 | 10,352 | 15,064 | 0.1 | 0.1 | 0.1 | 68.7 |
| 90-94 | 6,475 | 2,399 | 4,076 | 0 | 0 | 0 | 58.9 |
| 95-99 | 942 | 302 | 640 | 0 | 0 | 0 | 47.2 |
| 100+ | 74 | 19 | 55 | 0 | 0 | 0 | 34.5 |
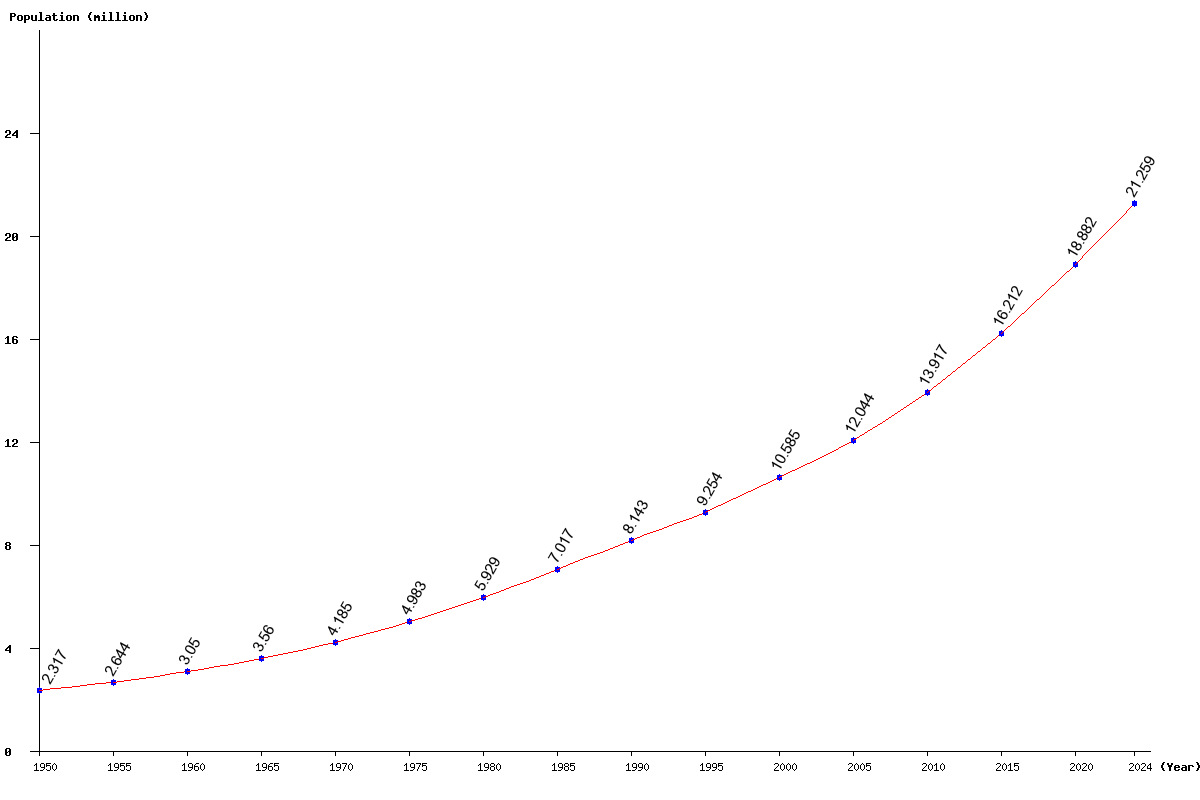
| Year | Population | Yearly % Change |
Yearly Change |
Sex ratio | Density (P/Km²) |
|---|---|---|---|---|---|
| 2025 | 21,892,487 | 2.98 | 633,121 | 99.55 | 29.45 |
| 2024 | 21,259,366 | 2.99 | 616,241 | 99.57 | 28.60 |
| 2023 | 20,643,125 | 3.00 | 600,576 | 99.58 | 27.77 |
| 2022 | 20,042,549 | 3.01 | 586,544 | 99.59 | 26.96 |
| 2021 | 19,456,005 | 3.04 | 573,672 | 99.60 | 26.17 |
| 2020 | 18,882,333 | 3.06 | 561,181 | 99.61 | 25.40 |
| 2019 | 18,321,152 | 3.09 | 548,317 | 99.63 | 24.65 |
| 2018 | 17,772,835 | 3.10 | 534,904 | 99.65 | 23.91 |
| 2017 | 17,237,931 | 3.11 | 520,599 | 99.67 | 23.19 |
| 2016 | 16,717,332 | 3.12 | 505,565 | 99.69 | 22.49 |
| 2015 | 16,211,767 | 3.12 | 490,424 | 99.70 | 21.81 |
| 2014 | 15,721,343 | 3.12 | 475,257 | 99.69 | 21.15 |
| 2013 | 15,246,086 | 3.11 | 459,505 | 99.67 | 20.51 |
| 2012 | 14,786,581 | 3.09 | 443,055 | 99.63 | 19.89 |
| 2011 | 14,343,526 | 3.06 | 426,087 | 99.59 | 19.29 |
| 2010 | 13,917,439 | 3.03 | 409,590 | 99.54 | 18.72 |
| 2005 | 12,043,591 | 13.78 | 1,458,371 | 99.20 | 16.20 |
| 2000 | 10,585,220 | 14.39 | 1,331,693 | 98.67 | 14.24 |
| 1995 | 9,253,527 | 13.64 | 1,110,385 | 98.39 | 12.45 |
| 1990 | 8,143,142 | 16.04 | 1,125,850 | 98.42 | 10.95 |
| 1985 | 7,017,292 | 18.35 | 1,087,795 | 98.61 | 9.44 |
| 1980 | 5,929,497 | 18.99 | 946,480 | 98.81 | 7.98 |
| 1975 | 4,983,017 | 19.06 | 797,639 | 98.76 | 6.70 |
| 1970 | 4,185,378 | 17.58 | 625,691 | 98.76 | 5.63 |
| 1965 | 3,559,687 | 16.73 | 510,101 | 98.71 | 4.79 |
| 1960 | 3,049,586 | 15.34 | 405,680 | 98.70 | 4.10 |
| 1955 | 2,643,906 | 14.11 | 326,956 | 98.83 | 3.56 |
| 1950 | 2,316,950 | 99.15 | 3.12 |