United Kingdom population
66,164,152
Births this year: 7,769,654
Births today 1,339
Deaths this year 6,035,930
Deaths today 1,040
66,164,152
| Region Name | Percents | Number |
|---|---|---|
| Christian (includes Anglican, Roman Catholic, Presbyterian, Methodist) | 59.5% | 38,336,105 people |
| Muslim | 4.4% | 2,834,939 people |
| Hindu | 1.3% | 837,596 people |
| other | 2% | 1,288,609 people |
| none | 25.7% | 16,558,620 people |
| unspecified | 7.2% | 4,638,991 people |
| Ethnic groups Name | Percents | Number |
|---|---|---|
| white | 87.2% | 56,183,333 people |
| black/African/Caribbean/black British | 3% | 1,932,913 people |
| British Indian | 2.3% | 1,481,900 people |
| Pakistani | 1.9% | 1,224,178 people |
| mixed | 2% | 1,288,609 people |
| other | 3.7% | 2,383,926 people |
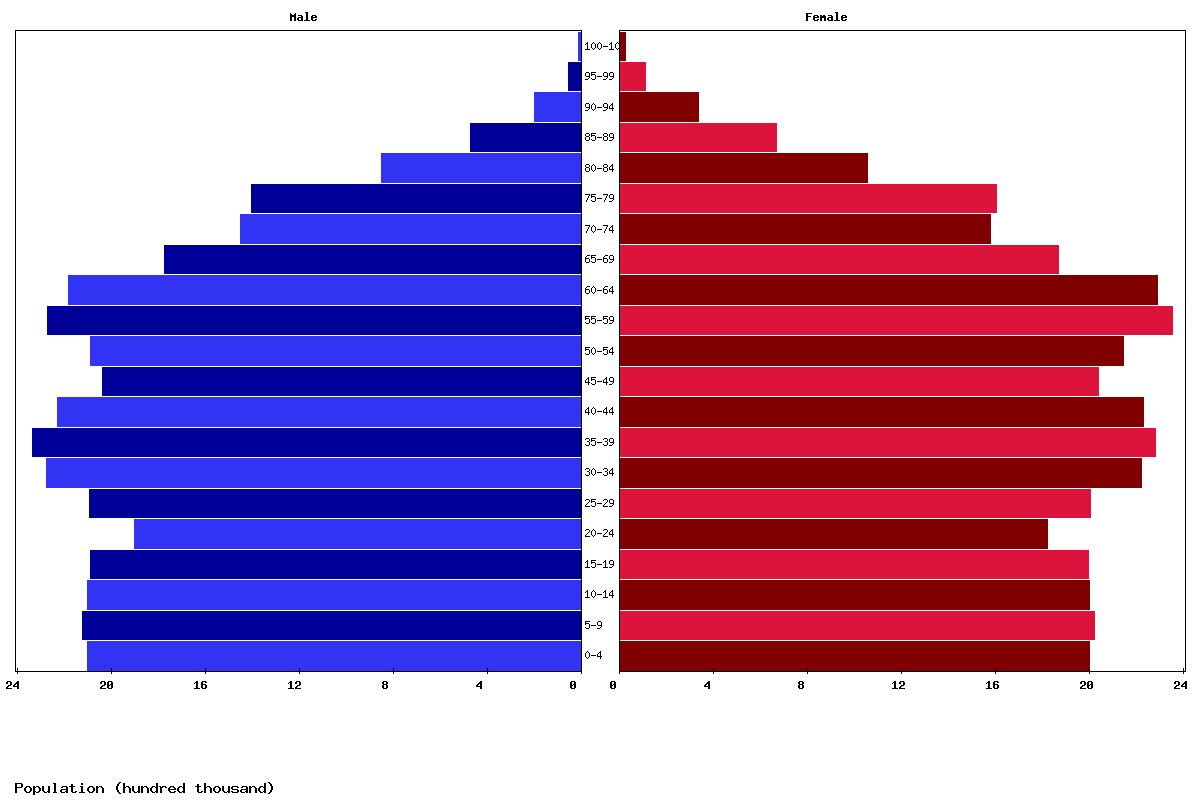
| Age | Both Sexes Population | Male Population | Female Population | Both Sexes (%) | Male (%) | Female (%) | Sex ratio (female/male) |
|---|---|---|---|---|---|---|---|
| Total | 68,527,121 | 33,924,882 | 34,602,239 | 100 | 100 | 100 | 98 |
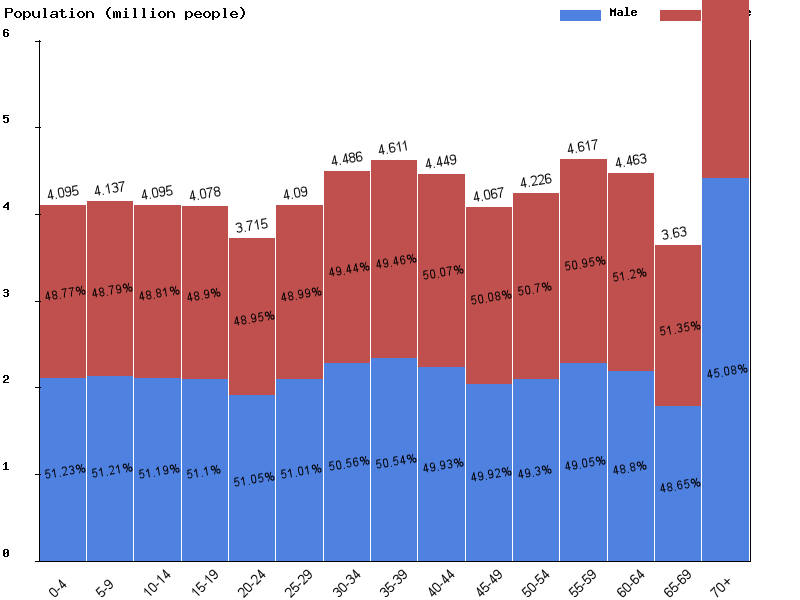
| 00-04 | 4,094,770 | 2,097,667 | 1,997,103 | 6 | 6.2 | 5.8 | 105 |
| 05-09 | 4,136,560 | 2,118,233 | 2,018,327 | 6 | 6.2 | 5.8 | 104.9 |
| 10-14 | 4,095,244 | 2,096,482 | 1,998,762 | 6 | 6.2 | 5.8 | 104.9 |
| 15-19 | 4,078,017 | 2,083,928 | 1,994,089 | 6 | 6.1 | 5.8 | 104.5 |
| 20-24 | 3,715,066 | 1,896,434 | 1,818,632 | 5.4 | 5.6 | 5.3 | 104.3 |
| 25-29 | 4,089,862 | 2,086,061 | 2,003,801 | 6 | 6.1 | 5.8 | 104.1 |
| 30-34 | 4,485,848 | 2,268,123 | 2,217,725 | 6.5 | 6.7 | 6.4 | 102.3 |
| 35-39 | 4,610,900 | 2,330,445 | 2,280,455 | 6.7 | 6.9 | 6.6 | 102.2 |
| 40-44 | 4,448,892 | 2,221,543 | 2,227,349 | 6.5 | 6.5 | 6.4 | 99.7 |
| 45-49 | 4,066,519 | 2,029,958 | 2,036,561 | 5.9 | 6 | 5.9 | 99.7 |
| 50-54 | 4,226,067 | 2,083,425 | 2,142,642 | 6.2 | 6.1 | 6.2 | 97.2 |
| 55-59 | 4,617,179 | 2,264,857 | 2,352,322 | 6.7 | 6.7 | 6.8 | 96.3 |
| 60-64 | 4,463,225 | 2,177,921 | 2,285,304 | 6.5 | 6.4 | 6.6 | 95.3 |
| 65-69 | 3,630,426 | 1,766,159 | 1,864,267 | 5.3 | 5.2 | 5.4 | 94.7 |
| 70-74 | 3,023,419 | 1,446,412 | 1,577,007 | 4.4 | 4.3 | 4.6 | 91.7 |
| 75-79 | 3,002,527 | 1,398,831 | 1,603,696 | 4.4 | 4.1 | 4.6 | 87.2 |
| 80-84 | 1,896,547 | 843,497 | 1,053,050 | 2.8 | 2.5 | 3 | 80.1 |
| 85-89 | 1,131,009 | 464,875 | 666,134 | 1.7 | 1.4 | 1.9 | 69.8 |
| 90-94 | 530,562 | 195,234 | 335,328 | 0.8 | 0.6 | 1 | 58.2 |
| 95-99 | 155,838 | 47,846 | 107,992 | 0.2 | 0.1 | 0.3 | 44.3 |
| 100+ | 28,644 | 6,951 | 21,693 | 0 | 0 | 0.1 | 32 |
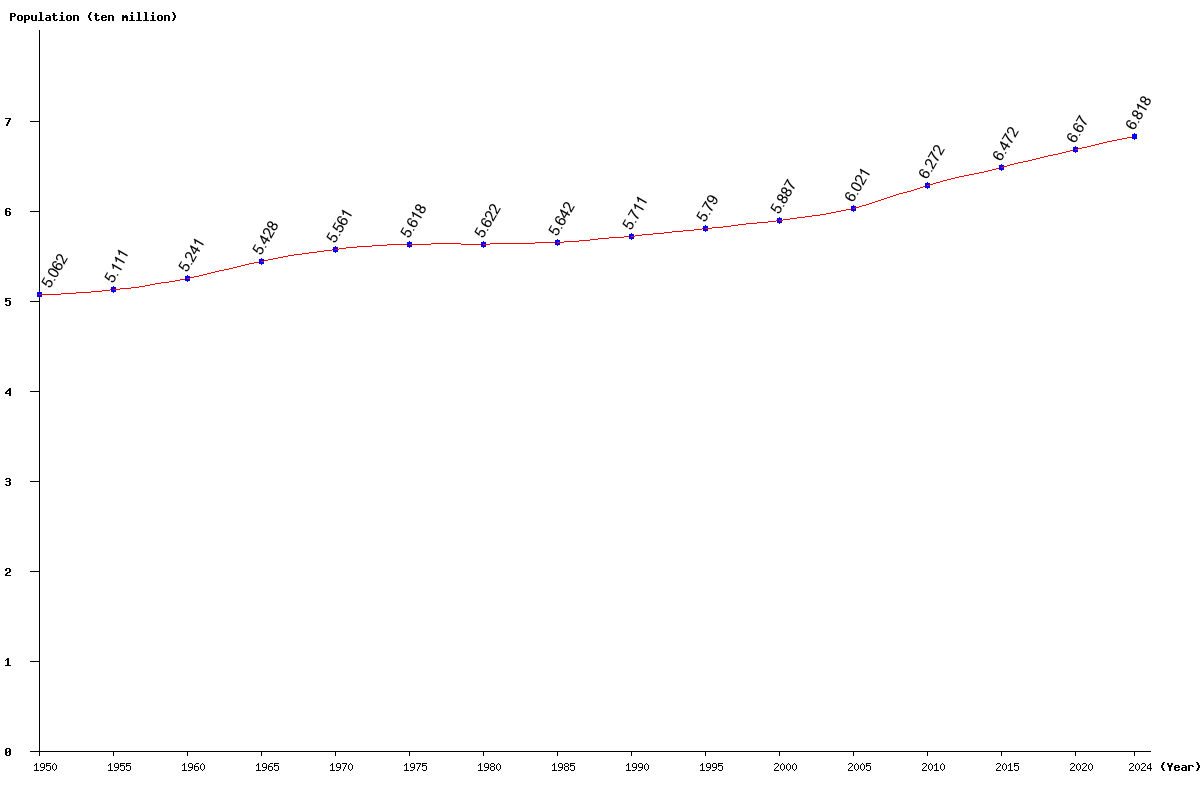
| Year | Population | Yearly % Change |
Yearly Change |
Sex ratio | Density (P/Km²) |
|---|---|---|---|---|---|
| 2025 | 68,527,121 | 0.51 | 346,992 | 98.04 | 283.25 |
| 2024 | 68,180,129 | 0.53 | 357,132 | 97.97 | 281.82 |
| 2023 | 67,822,997 | 0.54 | 366,474 | 97.90 | 280.34 |
| 2022 | 67,456,523 | 0.56 | 374,661 | 97.82 | 278.83 |
| 2021 | 67,081,862 | 0.57 | 381,736 | 97.75 | 277.28 |
| 2020 | 66,700,126 | 0.59 | 389,871 | 97.66 | 275.70 |
| 2019 | 66,310,255 | 0.60 | 397,686 | 97.58 | 274.09 |
| 2018 | 65,912,569 | 0.61 | 401,471 | 97.49 | 272.44 |
| 2017 | 65,511,098 | 0.61 | 399,955 | 97.40 | 270.79 |
| 2016 | 65,111,143 | 0.61 | 395,333 | 97.31 | 269.13 |
| 2015 | 64,715,810 | 0.60 | 384,462 | 97.20 | 267.50 |
| 2014 | 64,331,348 | 0.59 | 375,694 | 97.09 | 265.91 |
| 2013 | 63,955,654 | 0.60 | 381,888 | 96.97 | 264.36 |
| 2012 | 63,573,766 | 0.65 | 408,817 | 96.84 | 262.78 |
| 2011 | 63,164,949 | 0.71 | 448,265 | 96.71 | 261.09 |
| 2010 | 62,716,684 | 0.80 | 495,520 | 96.58 | 259.23 |
| 2005 | 60,210,012 | 2.28 | 1,343,008 | 95.90 | 248.87 |
| 2000 | 58,867,004 | 1.66 | 963,214 | 94.99 | 243.32 |
| 1995 | 57,903,790 | 1.39 | 793,673 | 94.56 | 239.34 |
| 1990 | 57,110,117 | 1.23 | 694,921 | 94.52 | 236.06 |
| 1985 | 56,415,196 | 0.34 | 193,683 | 94.55 | 233.19 |
| 1980 | 56,221,513 | 0.07 | 41,588 | 94.72 | 232.39 |
| 1975 | 56,179,925 | 1.02 | 568,524 | 94.70 | 232.22 |
| 1970 | 55,611,401 | 2.46 | 1,333,052 | 94.29 | 229.87 |
| 1965 | 54,278,349 | 3.56 | 1,867,853 | 94.17 | 224.36 |
| 1960 | 52,410,496 | 2.54 | 1,296,785 | 93.40 | 216.63 |
| 1955 | 51,113,711 | 0.98 | 497,699 | 92.75 | 211.27 |
| 1950 | 50,616,012 | 92.61 | 209.22 |