Russia population
139,089,142
Births this year: 16,047,342
Births today 845
Deaths this year 19,313,615
Deaths today 1,017
139,089,142
| Region Name | Percents | Number |
|---|---|---|
| Russian Orthodox 15-20 | 1520% | 2,163,802,308 people |
| Muslim 10-15 | 1015% | 1,444,907,462 people |
| other Christian | 2% | 2,847,108 people |
| Ethnic groups Name | Percents | Number |
|---|---|---|
| Russian | 77.7% | 110,610,157 people |
| Tatar | 3.7% | 5,267,150 people |
| Ukrainian | 1.4% | 1,992,976 people |
| Bashkir | 1.1% | 1,565,910 people |
| Chuvash | 1% | 1,423,554 people |
| Chechen | 1% | 1,423,554 people |
| other | 10.2% | 14,520,252 people |
| unspecified | 3.9% | 5,551,861 people |
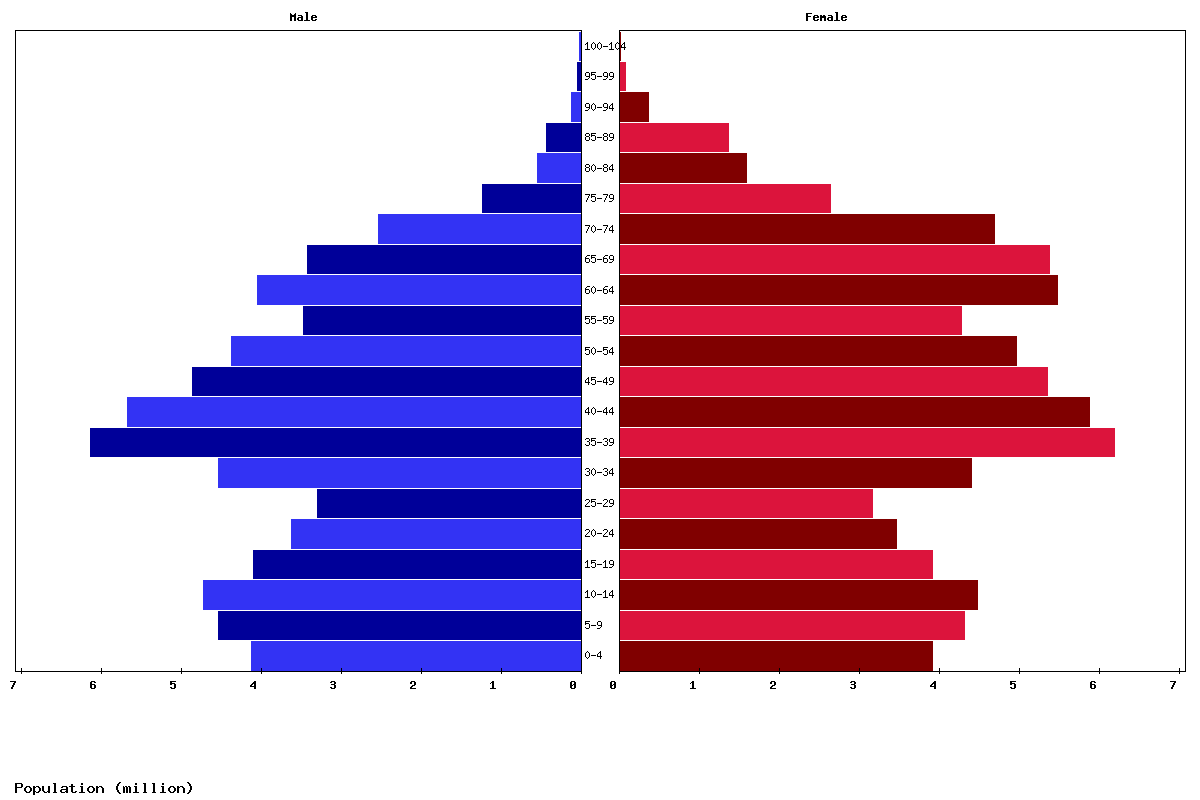
| Age | Both Sexes Population | Male Population | Female Population | Both Sexes (%) | Male (%) | Female (%) | Sex ratio (female/male) |
|---|---|---|---|---|---|---|---|
| Total | 141,205,239 | 65,498,218 | 75,707,021 | 100 | 100 | 100 | 86.5 |
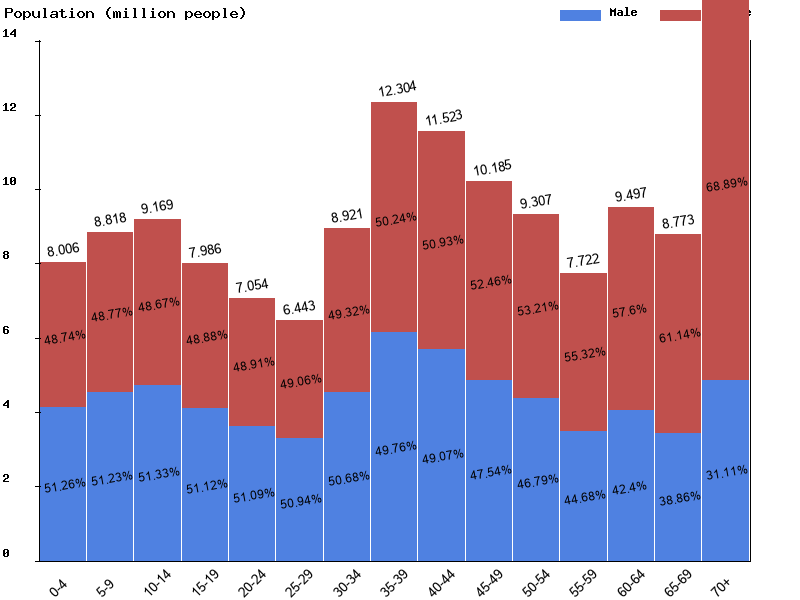
| 00-04 | 8,006,349 | 4,103,933 | 3,902,416 | 5.7 | 6.3 | 5.2 | 105.2 |
| 05-09 | 8,818,037 | 4,517,459 | 4,300,578 | 6.2 | 6.9 | 5.7 | 105 |
| 10-14 | 9,168,829 | 4,706,265 | 4,462,564 | 6.5 | 7.2 | 5.9 | 105.5 |
| 15-19 | 7,986,115 | 4,082,194 | 3,903,921 | 5.7 | 6.2 | 5.2 | 104.6 |
| 20-24 | 7,053,669 | 3,603,632 | 3,450,037 | 5 | 5.5 | 4.6 | 104.5 |
| 25-29 | 6,443,283 | 3,282,176 | 3,161,107 | 4.6 | 5 | 4.2 | 103.8 |
| 30-34 | 8,921,086 | 4,521,366 | 4,399,720 | 6.3 | 6.9 | 5.8 | 102.8 |
| 35-39 | 12,304,031 | 6,122,963 | 6,181,068 | 8.7 | 9.3 | 8.2 | 99.1 |
| 40-44 | 11,523,450 | 5,655,112 | 5,868,338 | 8.2 | 8.6 | 7.8 | 96.4 |
| 45-49 | 10,185,130 | 4,842,367 | 5,342,763 | 7.2 | 7.4 | 7.1 | 90.6 |
| 50-54 | 9,307,201 | 4,354,602 | 4,952,599 | 6.6 | 6.6 | 6.5 | 87.9 |
| 55-59 | 7,721,584 | 3,450,165 | 4,271,419 | 5.5 | 5.3 | 5.6 | 80.8 |
| 60-64 | 9,496,614 | 4,026,162 | 5,470,452 | 6.7 | 6.1 | 7.2 | 73.6 |
| 65-69 | 8,773,447 | 3,409,430 | 5,364,017 | 6.2 | 5.2 | 7.1 | 63.6 |
| 70-74 | 7,199,786 | 2,514,365 | 4,685,421 | 5.1 | 3.8 | 6.2 | 53.7 |
| 75-79 | 3,848,551 | 1,215,867 | 2,632,684 | 2.7 | 1.9 | 3.5 | 46.2 |
| 80-84 | 2,114,861 | 534,440 | 1,580,421 | 1.5 | 0.8 | 2.1 | 33.8 |
| 85-89 | 1,765,269 | 413,706 | 1,351,563 | 1.3 | 0.6 | 1.8 | 30.6 |
| 90-94 | 461,450 | 109,641 | 351,809 | 0.3 | 0.2 | 0.5 | 31.2 |
| 95-99 | 100,529 | 30,151 | 70,378 | 0.1 | 0 | 0.1 | 42.8 |
| 100+ | 5,968 | 2,222 | 3,746 | 0 | 0 | 0 | 59.3 |
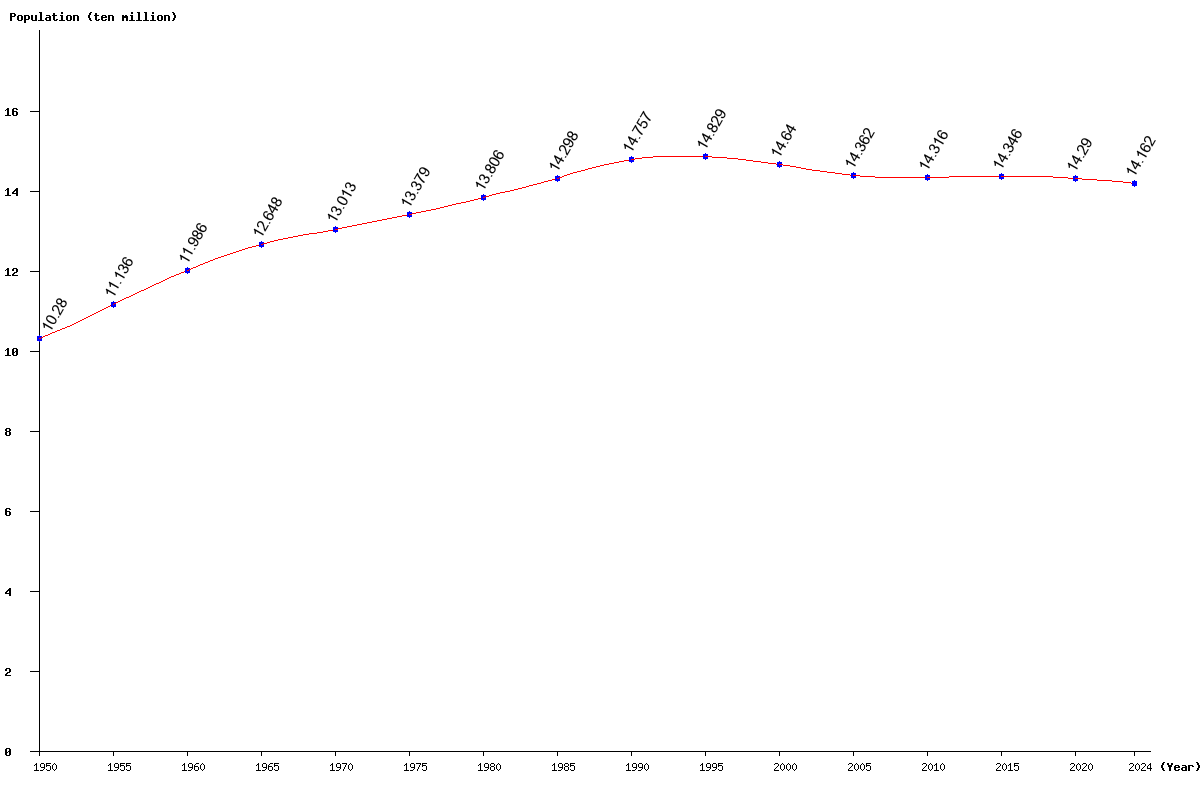
| Year | Population | Yearly % Change |
Yearly Change |
Sex ratio | Density (P/Km²) |
|---|---|---|---|---|---|
| 2025 | 141,205,239 | -0.30 | -419,499 | 86.52 | 8.62 |
| 2024 | 141,624,738 | -0.27 | -383,177 | 86.57 | 8.65 |
| 2023 | 142,007,915 | -0.24 | -342,725 | 86.62 | 8.67 |
| 2022 | 142,350,640 | -0.21 | -297,734 | 86.66 | 8.69 |
| 2021 | 142,648,374 | -0.17 | -249,750 | 86.70 | 8.71 |
| 2020 | 142,898,124 | -0.14 | -203,712 | 86.73 | 8.73 |
| 2019 | 143,101,836 | -0.11 | -159,654 | 86.76 | 8.74 |
| 2018 | 143,261,490 | -0.08 | -113,516 | 86.78 | 8.75 |
| 2017 | 143,375,006 | -0.05 | -64,826 | 86.80 | 8.75 |
| 2016 | 143,439,832 | -0.01 | -17,086 | 86.79 | 8.76 |
| 2015 | 143,456,918 | 0.02 | 27,483 | 86.76 | 8.76 |
| 2014 | 143,429,435 | 0.04 | 62,094 | 86.70 | 8.76 |
| 2013 | 143,367,341 | 0.06 | 79,805 | 86.63 | 8.75 |
| 2012 | 143,287,536 | 0.05 | 76,060 | 86.55 | 8.75 |
| 2011 | 143,211,476 | 0.04 | 53,377 | 86.49 | 8.74 |
| 2010 | 143,158,099 | 0.02 | 31,439 | 86.48 | 8.74 |
| 2005 | 143,622,566 | -1.90 | -2,778,385 | 87.04 | 8.77 |
| 2000 | 146,400,951 | -1.28 | -1,892,314 | 87.96 | 8.94 |
| 1995 | 148,293,265 | 0.49 | 724,713 | 88.37 | 9.06 |
| 1990 | 147,568,552 | 3.21 | 4,592,799 | 88.03 | 9.01 |
| 1985 | 142,975,753 | 3.56 | 4,912,691 | 86.68 | 8.73 |
| 1980 | 138,063,062 | 3.20 | 4,274,949 | 85.69 | 8.43 |
| 1975 | 133,788,113 | 2.81 | 3,661,730 | 84.61 | 8.17 |
| 1970 | 130,126,383 | 2.88 | 3,642,509 | 83.97 | 7.95 |
| 1965 | 126,483,874 | 5.53 | 6,623,585 | 82.87 | 7.72 |
| 1960 | 119,860,289 | 7.64 | 8,505,065 | 81.12 | 7.32 |
| 1955 | 111,355,224 | 8.32 | 8,556,567 | 79.05 | 6.80 |
| 1950 | 102,798,657 | 76.56 | 6.28 |