China population
1,438,307,211
Births this year: 170,871,824
Births today 35,526
Deaths this year 106,105,891
Deaths today 22,061
1,438,307,211
| Region Name | Percents | Number |
|---|---|---|
| Buddhist | 18.2% | 249,984,513 people |
| Christian | 5.1% | 70,050,605 people |
| Muslim | 1.8% | 24,723,743 people |
| folk religion | 21.9% | 300,805,540 people |
| Hindu | 1% | 13,735,413 people |
| Jewish | 1% | 13,735,413 people |
| other (includes Daoist (Taoist)) | 0.7% | 9,614,789 people |
| unaffiliated | 52.2% | 716,988,547 people |
| Ethnic groups Name | Percents | Number |
|---|---|---|
| Han Chinese | 91.6% | 1,258,163,811 people |
| Zhuang | 1.3% | 17,856,037 people |
| other (includes Hui, Manchu, Uighur, Miao, Yi, Tujia, Tibetan, Mongol, Dong, Buyei, Yao, Bai, Korean, Hani, Li, Kazakh, Dai and other nationalities) | 7.1% | 97,521,431 people |
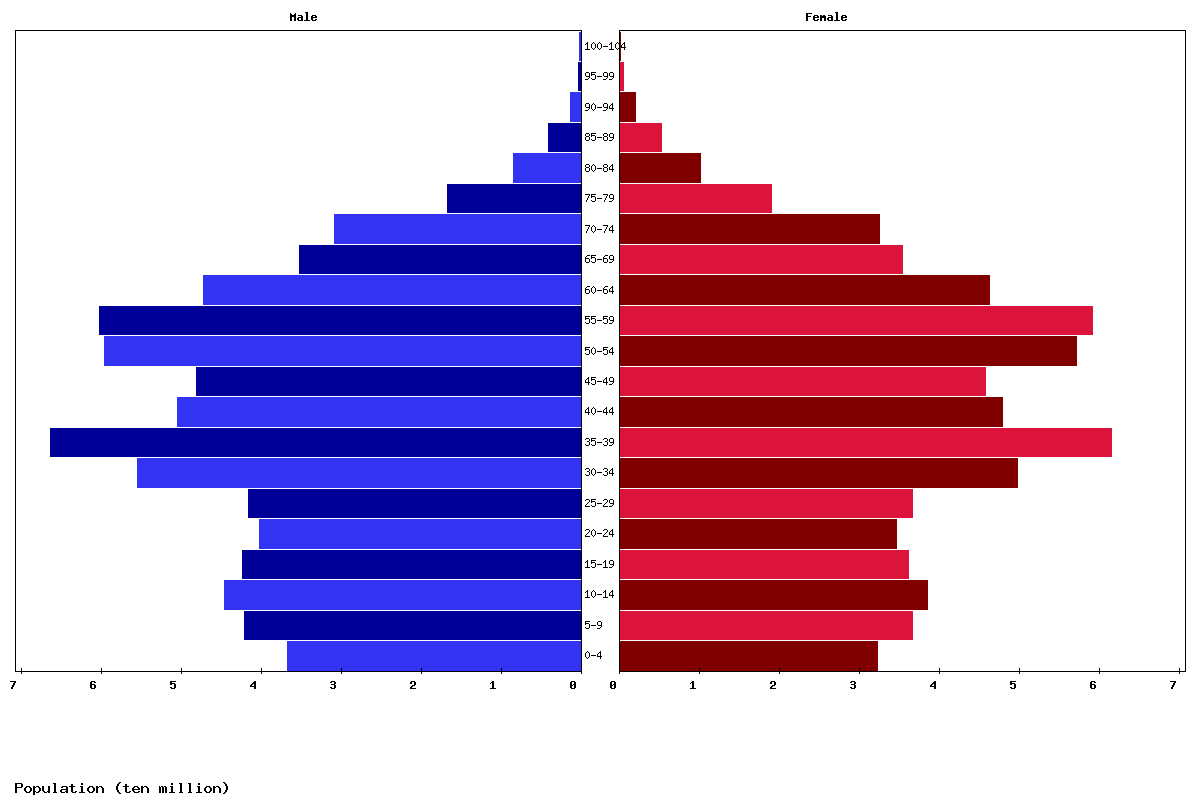
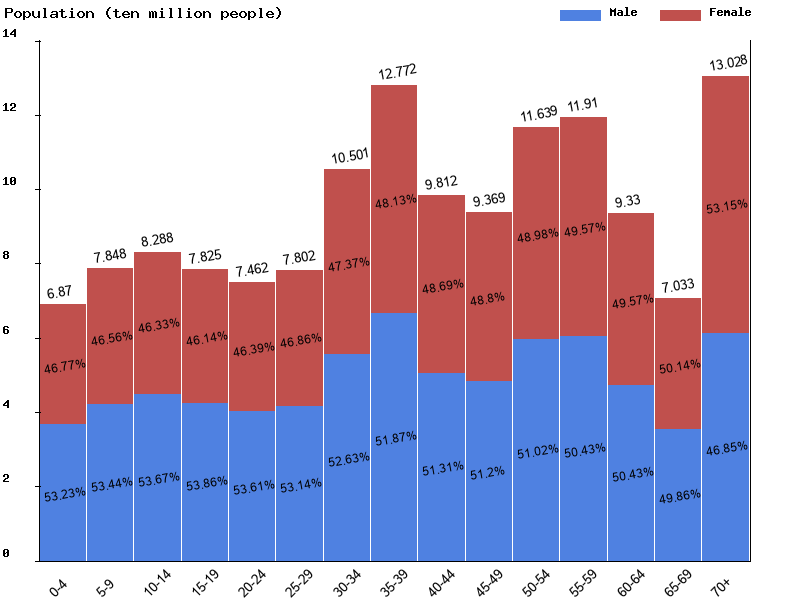
| Age | Both Sexes Population | Male Population | Female Population | Both Sexes (%) | Male (%) | Female (%) | Sex ratio (female/male) |
|---|---|---|---|---|---|---|---|
| Total | 1,414,872,342 | 729,025,072 | 685,847,270 | 100 | 100 | 100 | 106.3 |
| 00-04 | 68,697,288 | 36,567,501 | 32,129,787 | 4.9 | 5 | 4.7 | 113.8 |
| 05-09 | 78,480,091 | 41,941,853 | 36,538,238 | 5.5 | 5.8 | 5.3 | 114.8 |
| 10-14 | 82,877,865 | 44,478,671 | 38,399,194 | 5.9 | 6.1 | 5.6 | 115.8 |
| 15-19 | 78,254,598 | 42,145,255 | 36,109,343 | 5.5 | 5.8 | 5.3 | 116.7 |
| 20-24 | 74,616,563 | 40,001,297 | 34,615,266 | 5.3 | 5.5 | 5 | 115.6 |
| 25-29 | 78,017,367 | 41,461,115 | 36,556,252 | 5.5 | 5.7 | 5.3 | 113.4 |
| 30-34 | 105,009,246 | 55,267,885 | 49,741,361 | 7.4 | 7.6 | 7.3 | 111.1 |
| 35-39 | 127,722,676 | 66,244,535 | 61,478,141 | 9 | 9.1 | 9 | 107.8 |
| 40-44 | 98,115,092 | 50,341,200 | 47,773,892 | 6.9 | 6.9 | 7 | 105.4 |
| 45-49 | 93,687,127 | 47,966,435 | 45,720,692 | 6.6 | 6.6 | 6.7 | 104.9 |
| 50-54 | 116,388,633 | 59,383,139 | 57,005,494 | 8.2 | 8.1 | 8.3 | 104.2 |
| 55-59 | 119,099,327 | 60,067,235 | 59,032,092 | 8.4 | 8.2 | 8.6 | 101.8 |
| 60-64 | 93,302,586 | 47,054,369 | 46,248,217 | 6.6 | 6.5 | 6.7 | 101.7 |
| 65-69 | 70,327,089 | 35,068,104 | 35,258,985 | 5 | 4.8 | 5.1 | 99.5 |
| 70-74 | 63,187,724 | 30,739,214 | 32,448,510 | 4.5 | 4.2 | 4.7 | 94.7 |
| 75-79 | 35,567,462 | 16,585,605 | 18,981,857 | 2.5 | 2.3 | 2.8 | 87.4 |
| 80-84 | 18,391,605 | 8,311,602 | 10,080,003 | 1.3 | 1.1 | 1.5 | 82.5 |
| 85-89 | 9,162,832 | 3,924,359 | 5,238,473 | 0.6 | 0.5 | 0.8 | 74.9 |
| 90-94 | 3,198,160 | 1,225,654 | 1,972,506 | 0.2 | 0.2 | 0.3 | 62.1 |
| 95-99 | 671,330 | 223,493 | 447,837 | 0 | 0 | 0.1 | 49.9 |
| 100+ | 97,681 | 26,551 | 71,130 | 0 | 0 | 0 | 37.3 |
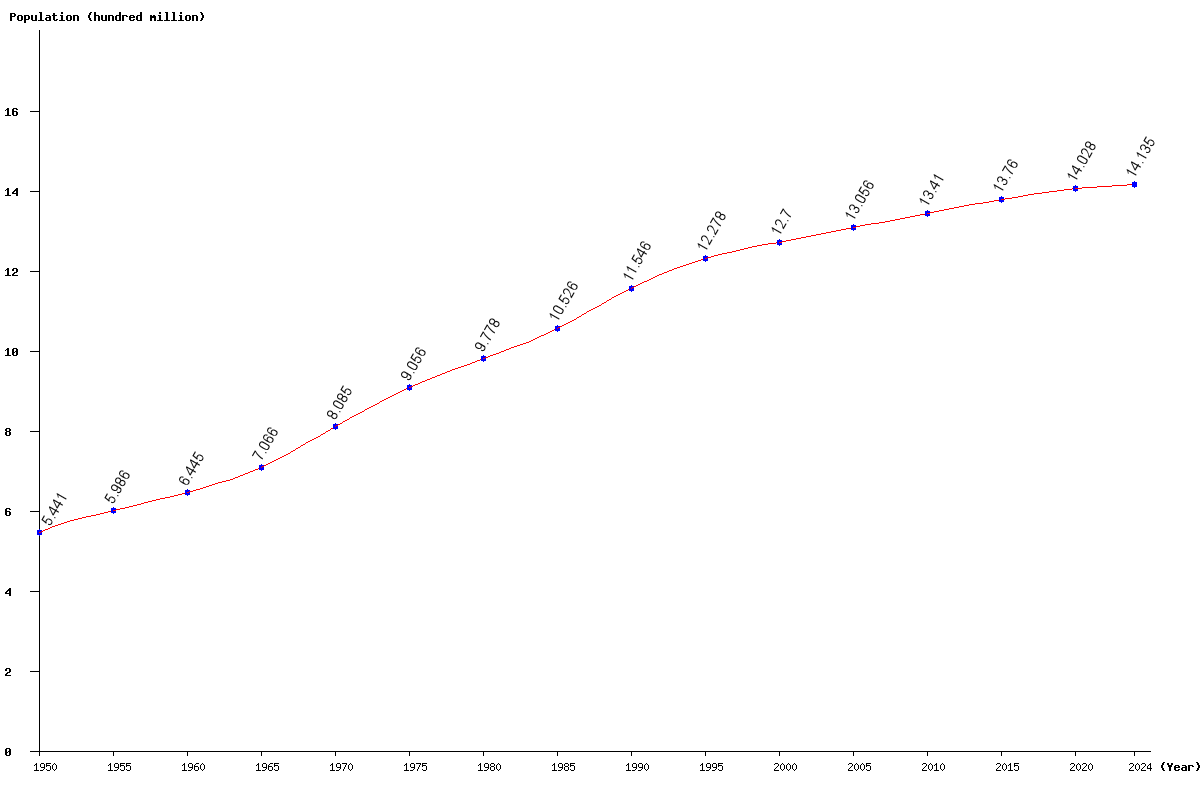
| Year | Population | Yearly % Change |
Yearly Change |
Sex ratio | Density (P/Km²) |
|---|---|---|---|---|---|
| 2025 | 1,414,872,342 | 0.10 | 1,360,146 | 106.30 | 150.71 |
| 2024 | 1,413,512,196 | 0.13 | 1,809,138 | 106.31 | 150.56 |
| 2023 | 1,411,703,058 | 0.17 | 2,328,078 | 106.32 | 150.37 |
| 2022 | 1,409,374,980 | 0.21 | 2,933,728 | 106.33 | 150.12 |
| 2021 | 1,406,441,252 | 0.26 | 3,593,414 | 106.34 | 149.81 |
| 2020 | 1,402,847,838 | 0.30 | 4,265,541 | 106.34 | 149.43 |
| 2019 | 1,398,582,297 | 0.35 | 4,895,804 | 106.34 | 148.97 |
| 2018 | 1,393,686,493 | 0.39 | 5,453,800 | 106.34 | 148.45 |
| 2017 | 1,388,232,693 | 0.43 | 5,909,361 | 106.32 | 147.87 |
| 2016 | 1,382,323,332 | 0.46 | 6,274,389 | 106.31 | 147.24 |
| 2015 | 1,376,048,943 | 0.48 | 6,613,273 | 106.28 | 146.57 |
| 2014 | 1,369,435,670 | 0.51 | 6,921,410 | 106.25 | 145.87 |
| 2013 | 1,362,514,260 | 0.53 | 7,127,308 | 106.21 | 145.13 |
| 2012 | 1,355,386,952 | 0.53 | 7,212,474 | 106.17 | 144.37 |
| 2011 | 1,348,174,478 | 0.54 | 7,205,741 | 106.12 | 143.60 |
| 2010 | 1,340,968,737 | 0.54 | 7,161,674 | 106.08 | 142.84 |
| 2005 | 1,305,600,630 | 2.81 | 35,626,058 | 105.87 | 139.07 |
| 2000 | 1,269,974,572 | 3.43 | 42,133,291 | 105.63 | 135.27 |
| 1995 | 1,227,841,281 | 6.34 | 73,235,508 | 105.57 | 130.79 |
| 1990 | 1,154,605,773 | 9.69 | 101,983,363 | 105.41 | 122.98 |
| 1985 | 1,052,622,410 | 7.65 | 74,784,977 | 105.24 | 112.12 |
| 1980 | 977,837,433 | 7.98 | 72,256,988 | 105.29 | 104.16 |
| 1975 | 905,580,445 | 12.01 | 97,069,732 | 105.25 | 96.46 |
| 1970 | 808,510,713 | 14.42 | 101,919,766 | 105.26 | 86.12 |
| 1965 | 706,590,947 | 9.64 | 62,140,774 | 105.64 | 75.26 |
| 1960 | 644,450,173 | 7.66 | 45,875,932 | 106.12 | 68.64 |
| 1955 | 598,574,241 | 10.01 | 54,461,318 | 106.88 | 63.76 |
| 1950 | 544,112,923 | 107.63 | 57.96 |