Brazil population
204,289,679
Births this year: 0
Births today 0
Deaths this year 1,533,986
Deaths today 36
204,289,679
| Region Name | Percents | Number |
|---|---|---|
| Roman Catholic | 64.6% | 132,962,088 people |
| other Catholic | 0.4% | 823,295 people |
| Protestant (includes Adventist, Assembly of God, Christian Congregation of Brazil, Universal Kingdom of God, other Protestant) | 22.2% | 45,692,854 people |
| other Christian | 0.7% | 1,440,766 people |
| Spiritist | 2.2% | 4,528,121 people |
| other | 1.4% | 2,881,531 people |
| none | 8% | 16,465,893 people |
| unspecified | 0.4% | 823,295 people |
| Ethnic groups Name | Percents | Number |
|---|---|---|
| white | 47.7% | 98,177,888 people |
| mulatto (mixed white and black) | 43.1% | 88,710,000 people |
| black | 7.6% | 15,642,599 people |
| Asian | 1.1% | 2,264,060 people |
| indigenous | 0.4% | 823,295 people |
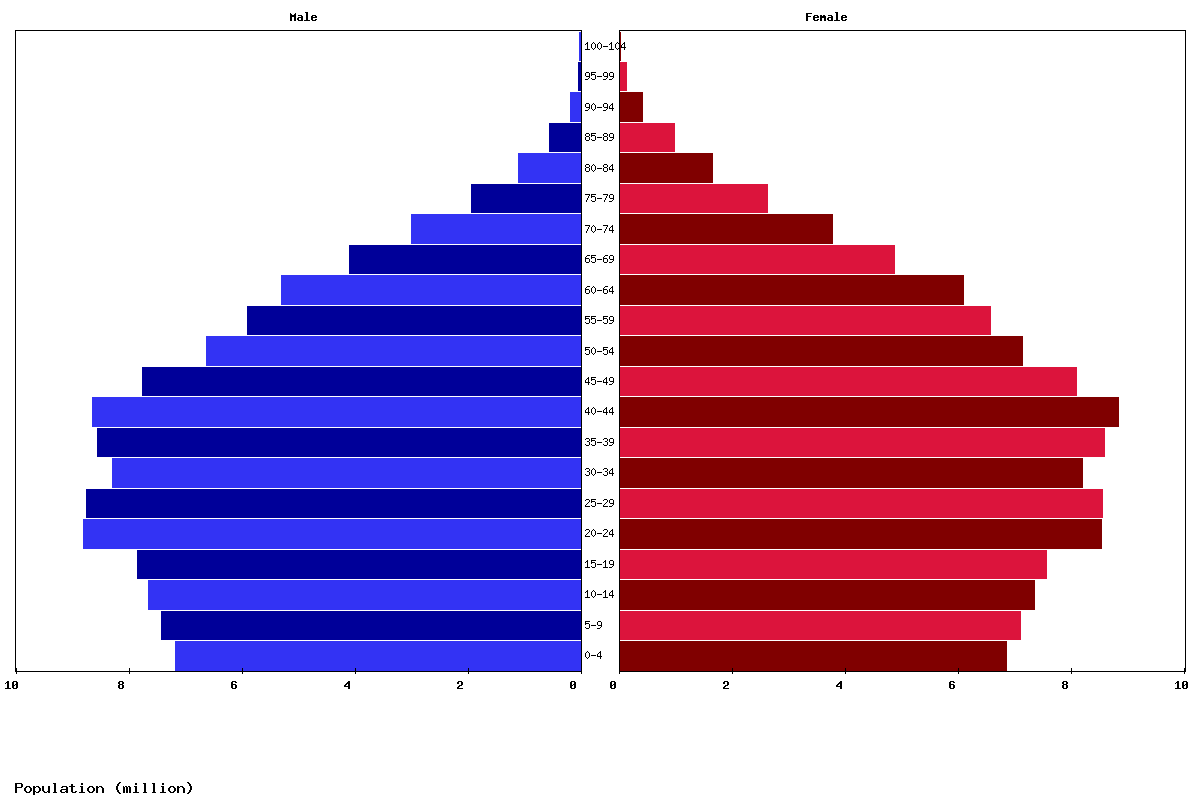
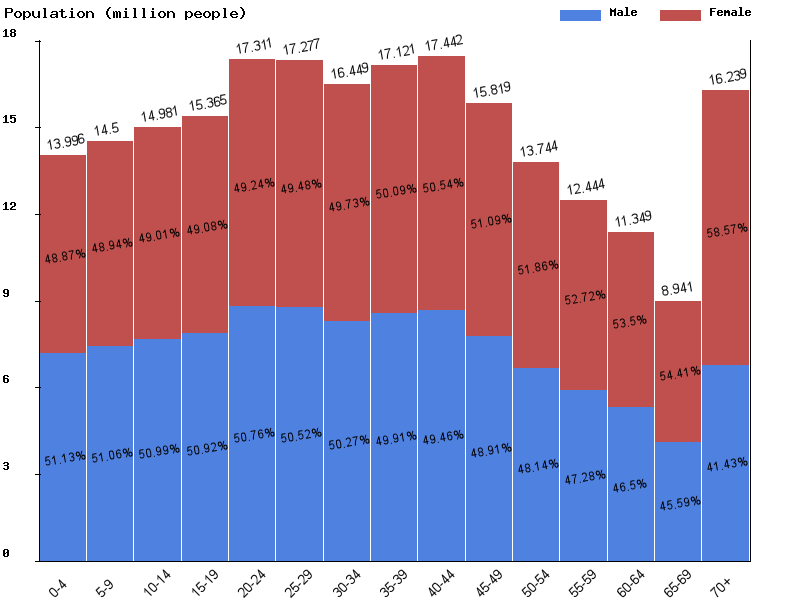
| Age | Both Sexes Population | Male Population | Female Population | Both Sexes (%) | Male (%) | Female (%) | Sex ratio (female/male) |
|---|---|---|---|---|---|---|---|
| Total | 222,976,301 | 109,297,506 | 113,678,795 | 100 | 100 | 100 | 96.1 |
| 00-04 | 13,995,604 | 7,155,380 | 6,840,224 | 6.3 | 6.5 | 6 | 104.6 |
| 05-09 | 14,499,513 | 7,402,959 | 7,096,554 | 6.5 | 6.8 | 6.2 | 104.3 |
| 10-14 | 14,981,309 | 7,639,272 | 7,342,037 | 6.7 | 7 | 6.5 | 104 |
| 15-19 | 15,364,592 | 7,824,236 | 7,540,356 | 6.9 | 7.2 | 6.6 | 103.8 |
| 20-24 | 17,310,886 | 8,786,907 | 8,523,979 | 7.8 | 8 | 7.5 | 103.1 |
| 25-29 | 17,276,826 | 8,728,552 | 8,548,274 | 7.7 | 8 | 7.5 | 102.1 |
| 30-34 | 16,449,121 | 8,269,054 | 8,180,067 | 7.4 | 7.6 | 7.2 | 101.1 |
| 35-39 | 17,120,846 | 8,545,567 | 8,575,279 | 7.7 | 7.8 | 7.5 | 99.7 |
| 40-44 | 17,442,480 | 8,627,438 | 8,815,042 | 7.8 | 7.9 | 7.8 | 97.9 |
| 45-49 | 15,818,644 | 7,737,198 | 8,081,446 | 7.1 | 7.1 | 7.1 | 95.7 |
| 50-54 | 13,743,723 | 6,616,268 | 7,127,455 | 6.2 | 6.1 | 6.3 | 92.8 |
| 55-59 | 12,443,898 | 5,883,050 | 6,560,848 | 5.6 | 5.4 | 5.8 | 89.7 |
| 60-64 | 11,348,712 | 5,276,925 | 6,071,787 | 5.1 | 4.8 | 5.3 | 86.9 |
| 65-69 | 8,941,444 | 4,076,388 | 4,865,056 | 4 | 3.7 | 4.3 | 83.8 |
| 70-74 | 6,755,507 | 2,987,866 | 3,767,641 | 3 | 2.7 | 3.3 | 79.3 |
| 75-79 | 4,542,607 | 1,924,007 | 2,618,600 | 2 | 1.8 | 2.3 | 73.5 |
| 80-84 | 2,717,989 | 1,080,407 | 1,637,582 | 1.2 | 1 | 1.4 | 66 |
| 85-89 | 1,505,003 | 536,774 | 968,229 | 0.7 | 0.5 | 0.9 | 55.4 |
| 90-94 | 554,577 | 164,642 | 389,935 | 0.2 | 0.2 | 0.3 | 42.2 |
| 95-99 | 144,168 | 31,876 | 112,292 | 0.1 | 0 | 0.1 | 28.4 |
| 100+ | 18,852 | 2,740 | 16,112 | 0 | 0 | 0 | 17 |
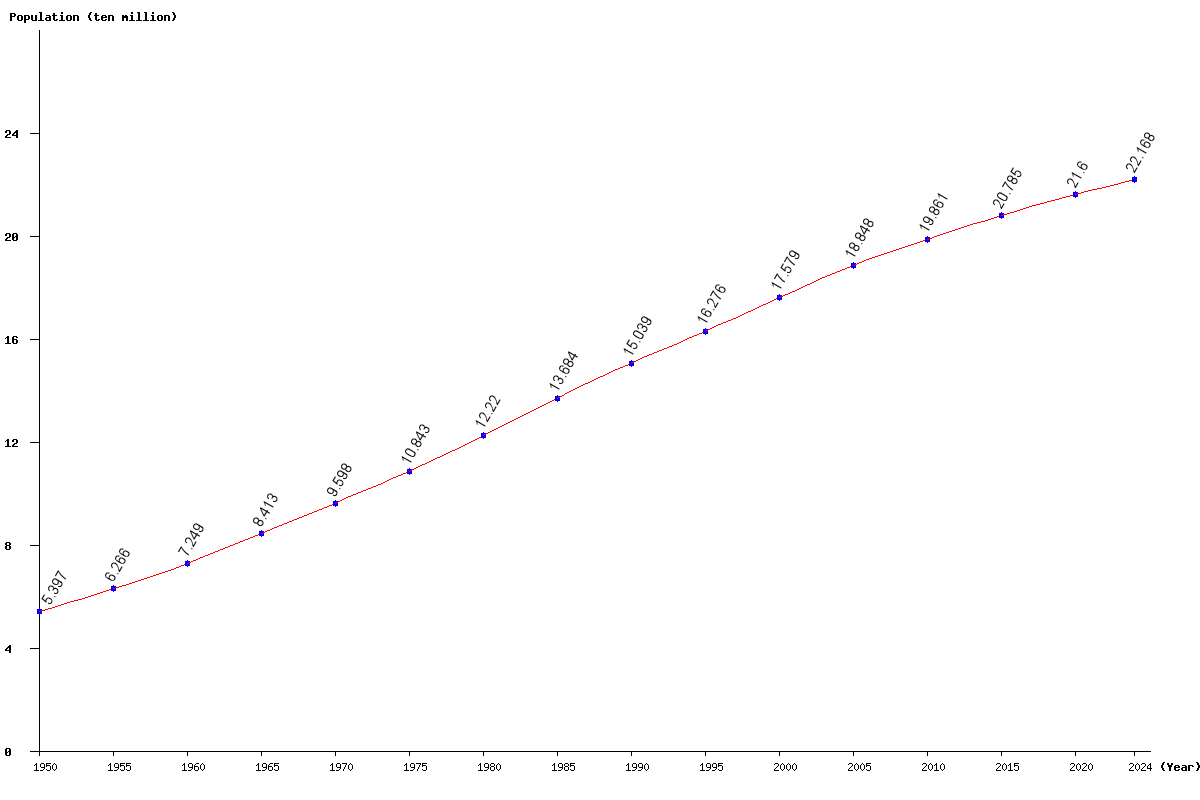
| Year | Population | Yearly % Change |
Yearly Change |
Sex ratio | Density (P/Km²) |
|---|---|---|---|---|---|
| 2025 | 222,976,301 | 0.58 | 1,295,650 | 96.15 | 26.68 |
| 2024 | 221,680,651 | 0.61 | 1,347,169 | 96.20 | 26.52 |
| 2023 | 220,333,482 | 0.64 | 1,397,366 | 96.26 | 26.36 |
| 2022 | 218,936,116 | 0.66 | 1,445,948 | 96.32 | 26.19 |
| 2021 | 217,490,168 | 0.69 | 1,493,154 | 96.37 | 26.02 |
| 2020 | 215,997,014 | 0.72 | 1,539,204 | 96.43 | 25.84 |
| 2019 | 214,457,810 | 0.74 | 1,584,659 | 96.49 | 25.66 |
| 2018 | 212,873,151 | 0.77 | 1,629,931 | 96.55 | 25.47 |
| 2017 | 211,243,220 | 0.80 | 1,675,300 | 96.61 | 25.27 |
| 2016 | 209,567,920 | 0.83 | 1,720,392 | 96.68 | 25.07 |
| 2015 | 207,847,528 | 0.86 | 1,769,630 | 96.74 | 24.87 |
| 2014 | 206,077,898 | 0.89 | 1,818,521 | 96.80 | 24.66 |
| 2013 | 204,259,377 | 0.92 | 1,857,793 | 96.87 | 24.44 |
| 2012 | 202,401,584 | 0.94 | 1,884,000 | 96.93 | 24.22 |
| 2011 | 200,517,584 | 0.96 | 1,903,376 | 97.00 | 23.99 |
| 2010 | 198,614,208 | 0.97 | 1,912,910 | 97.07 | 23.76 |
| 2005 | 188,479,240 | 7.22 | 12,692,799 | 97.40 | 22.55 |
| 2000 | 175,786,441 | 8.01 | 13,031,387 | 97.68 | 21.03 |
| 1995 | 162,755,054 | 8.22 | 12,361,911 | 97.98 | 19.47 |
| 1990 | 150,393,143 | 9.91 | 13,556,715 | 98.39 | 17.99 |
| 1985 | 136,836,428 | 11.98 | 14,636,707 | 98.71 | 16.37 |
| 1980 | 122,199,721 | 12.70 | 13,768,437 | 98.91 | 14.62 |
| 1975 | 108,431,284 | 12.97 | 12,448,831 | 99.09 | 12.97 |
| 1970 | 95,982,453 | 14.09 | 11,852,392 | 99.30 | 11.48 |
| 1965 | 84,130,061 | 16.05 | 11,636,476 | 99.37 | 10.07 |
| 1960 | 72,493,585 | 15.70 | 9,837,601 | 99.17 | 8.67 |
| 1955 | 62,655,984 | 16.08 | 8,681,258 | 98.82 | 7.50 |
| 1950 | 53,974,726 | 98.45 | 6.46 |