United States population
337,918,323
Births this year: 40,473,243
Births today 7,089
Deaths this year 26,550,447
Deaths today 4,650
337,918,323
| Region Name | Percents | Number |
|---|---|---|
| Protestant | 51.3% | 166,209,706 people |
| Roman Catholic | 23.9% | 77,434,931 people |
| Mormon | 1.7% | 5,507,924 people |
| other Christian | 1.6% | 5,183,928 people |
| Jewish | 1.7% | 5,507,924 people |
| Buddhist | 0.7% | 2,267,969 people |
| Muslim | 0.6% | 1,943,973 people |
| other or unspecified | 2.5% | 8,099,888 people |
| unaffiliated | 12.1% | 39,203,459 people |
| none | 4% | 12,959,821 people |
| Ethnic groups Name | Percents | Number |
|---|---|---|
| white | 79.96% | 259,066,824 people |
| black | 12.85% | 41,633,425 people |
| Asian | 4.43% | 14,353,002 people |
| Amerindian and Alaska native | 0.97% | 3,142,757 people |
| native Hawaiian and other Pacific islander | 0.18% | 583,192 people |
| two or more races | 1.61% | 5,216,328 people |
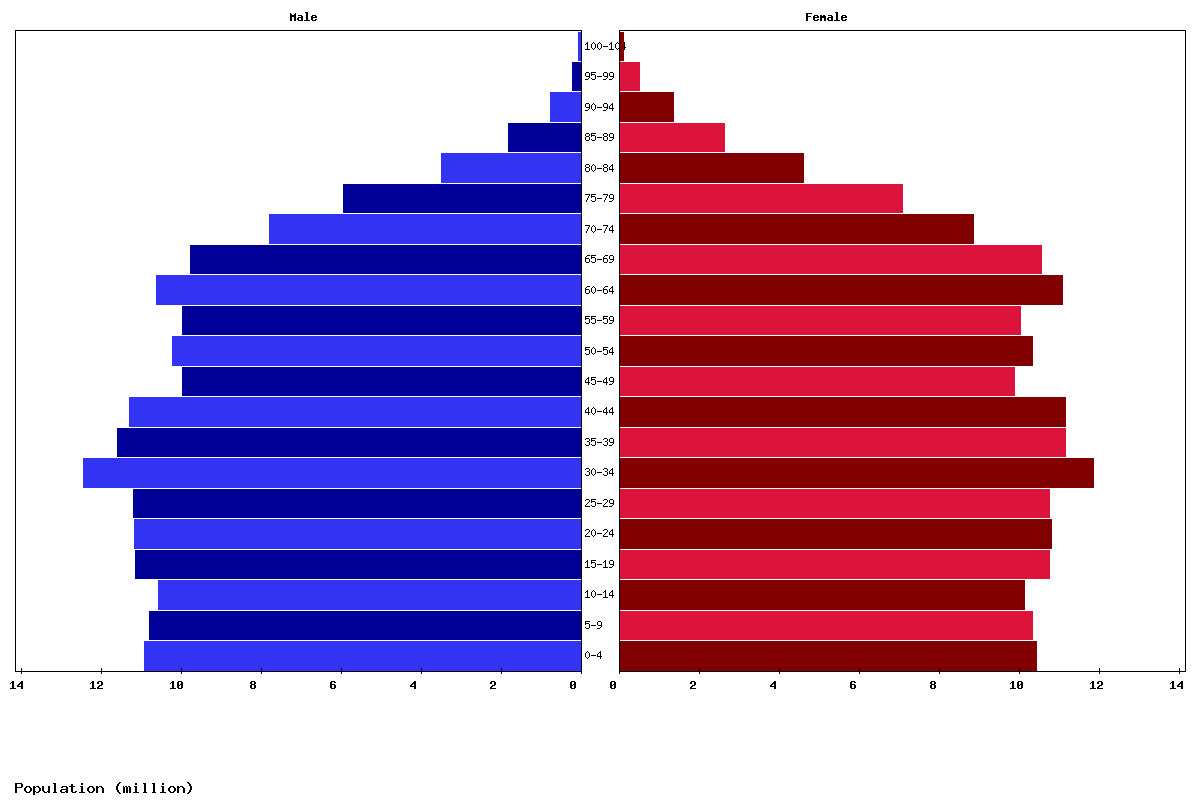
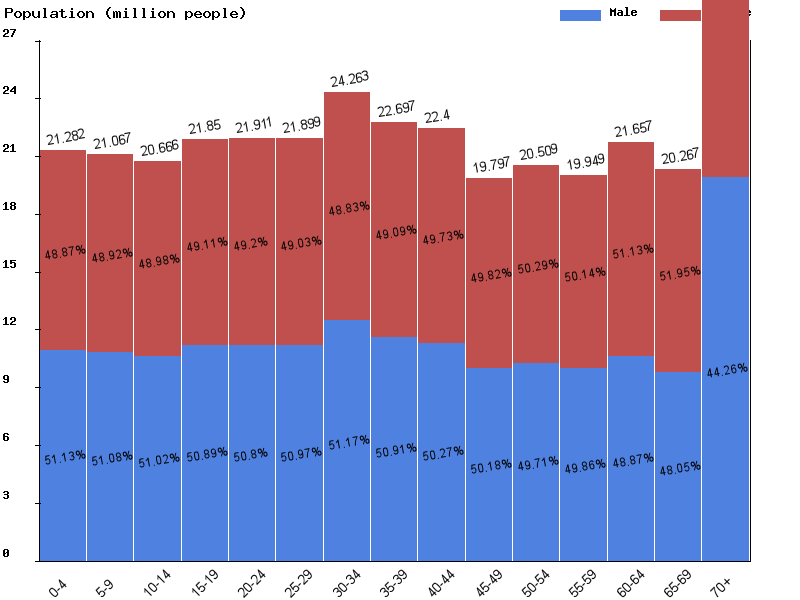
| Age | Both Sexes Population | Male Population | Female Population | Both Sexes (%) | Male (%) | Female (%) | Sex ratio (female/male) |
|---|---|---|---|---|---|---|---|
| Total | 345,084,551 | 171,086,010 | 173,998,541 | 100 | 100 | 100 | 98.3 |
| 00-04 | 21,282,091 | 10,881,299 | 10,400,792 | 6.2 | 6.4 | 6 | 104.6 |
| 05-09 | 21,067,227 | 10,760,693 | 10,306,534 | 6.1 | 6.3 | 5.9 | 104.4 |
| 10-14 | 20,665,959 | 10,543,044 | 10,122,915 | 6 | 6.2 | 5.8 | 104.2 |
| 15-19 | 21,849,693 | 11,119,585 | 10,730,108 | 6.3 | 6.5 | 6.2 | 103.6 |
| 20-24 | 21,910,763 | 11,129,815 | 10,780,948 | 6.3 | 6.5 | 6.2 | 103.2 |
| 25-29 | 21,898,651 | 11,161,658 | 10,736,993 | 6.3 | 6.5 | 6.2 | 104 |
| 30-34 | 24,263,160 | 12,415,523 | 11,847,637 | 7 | 7.3 | 6.8 | 104.8 |
| 35-39 | 22,696,822 | 11,554,872 | 11,141,950 | 6.6 | 6.8 | 6.4 | 103.7 |
| 40-44 | 22,400,246 | 11,260,601 | 11,139,645 | 6.5 | 6.6 | 6.4 | 101.1 |
| 45-49 | 19,796,538 | 9,934,238 | 9,862,300 | 5.7 | 5.8 | 5.7 | 100.7 |
| 50-54 | 20,508,703 | 10,194,531 | 10,314,172 | 5.9 | 6 | 5.9 | 98.8 |
| 55-59 | 19,949,374 | 9,946,321 | 10,003,053 | 5.8 | 5.8 | 5.7 | 99.4 |
| 60-64 | 21,656,874 | 10,583,097 | 11,073,777 | 6.3 | 6.2 | 6.4 | 95.6 |
| 65-69 | 20,266,623 | 9,738,431 | 10,528,192 | 5.9 | 5.7 | 6.1 | 92.5 |
| 70-74 | 16,594,890 | 7,767,318 | 8,827,572 | 4.8 | 4.5 | 5.1 | 88 |
| 75-79 | 12,955,986 | 5,901,802 | 7,054,184 | 3.8 | 3.4 | 4.1 | 83.7 |
| 80-84 | 8,050,796 | 3,457,920 | 4,592,876 | 2.3 | 2 | 2.6 | 75.3 |
| 85-89 | 4,400,099 | 1,784,685 | 2,615,414 | 1.3 | 1 | 1.5 | 68.2 |
| 90-94 | 2,080,972 | 732,320 | 1,348,652 | 0.6 | 0.4 | 0.8 | 54.3 |
| 95-99 | 669,505 | 191,785 | 477,720 | 0.2 | 0.1 | 0.3 | 40.1 |
| 100+ | 119,579 | 26,472 | 93,107 | 0 | 0 | 0.1 | 28.4 |
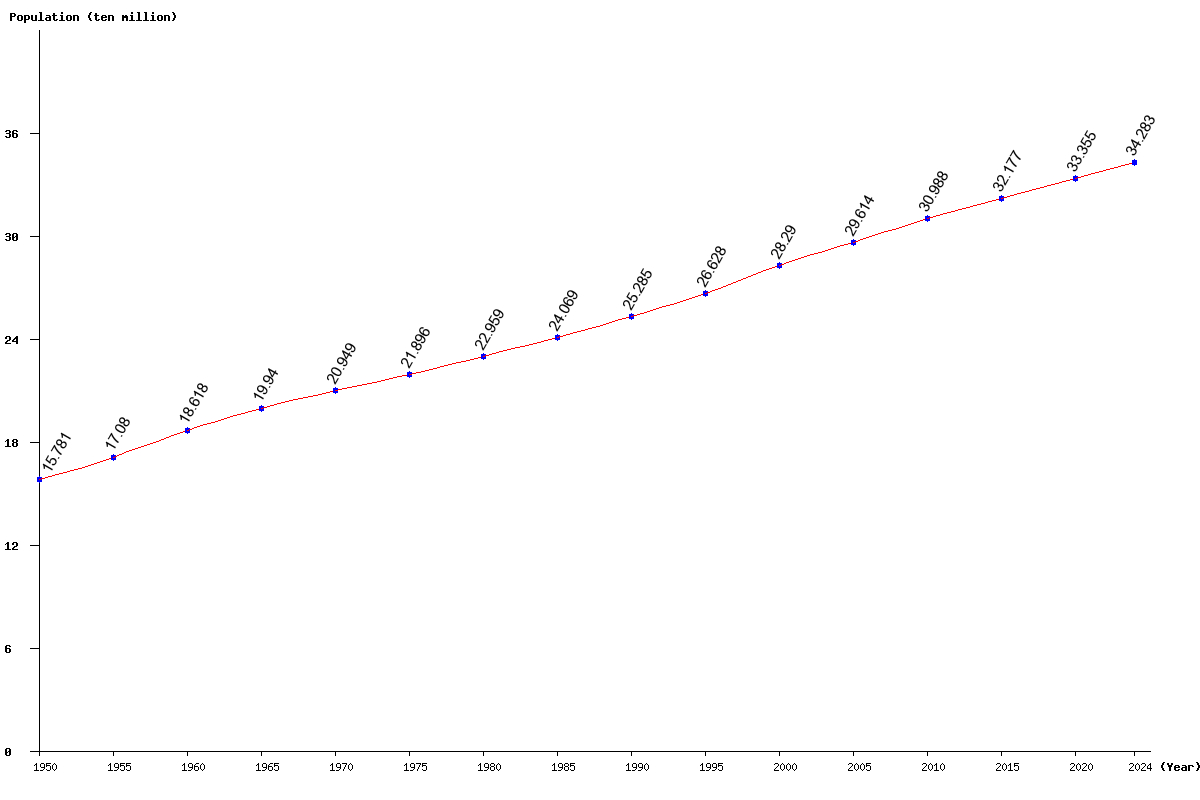
| Year | Population | Yearly % Change |
Yearly Change |
Sex ratio | Density (P/Km²) |
|---|---|---|---|---|---|
| 2025 | 345,084,551 | 0.66 | 2,256,968 | 98.33 | 37.72 |
| 2024 | 342,827,583 | 0.67 | 2,290,978 | 98.33 | 37.48 |
| 2023 | 340,536,605 | 0.69 | 2,316,928 | 98.33 | 37.23 |
| 2022 | 338,219,677 | 0.69 | 2,332,931 | 98.33 | 36.97 |
| 2021 | 335,886,746 | 0.70 | 2,341,216 | 98.33 | 36.72 |
| 2020 | 333,545,530 | 0.71 | 2,350,166 | 98.33 | 36.46 |
| 2019 | 331,195,364 | 0.72 | 2,359,601 | 98.34 | 36.21 |
| 2018 | 328,835,763 | 0.72 | 2,361,750 | 98.34 | 35.95 |
| 2017 | 326,474,013 | 0.73 | 2,355,226 | 98.34 | 35.69 |
| 2016 | 324,118,787 | 0.73 | 2,345,156 | 98.32 | 35.43 |
| 2015 | 321,773,631 | 0.73 | 2,324,997 | 98.28 | 35.18 |
| 2014 | 319,448,634 | 0.73 | 2,312,715 | 98.22 | 34.92 |
| 2013 | 317,135,919 | 0.74 | 2,336,454 | 98.14 | 34.67 |
| 2012 | 314,799,465 | 0.77 | 2,409,097 | 98.05 | 34.41 |
| 2011 | 312,390,368 | 0.81 | 2,514,198 | 97.97 | 34.15 |
| 2010 | 309,876,170 | 0.86 | 2,644,209 | 97.90 | 33.88 |
| 2005 | 296,139,635 | 4.68 | 13,243,894 | 97.74 | 32.37 |
| 2000 | 282,895,741 | 6.24 | 16,620,213 | 97.36 | 30.93 |
| 1995 | 266,275,528 | 5.31 | 13,427,718 | 96.78 | 29.11 |
| 1990 | 252,847,810 | 5.05 | 12,156,253 | 96.21 | 27.64 |
| 1985 | 240,691,557 | 4.84 | 11,103,349 | 96.14 | 26.31 |
| 1980 | 229,588,208 | 4.85 | 10,624,647 | 96.10 | 25.10 |
| 1975 | 218,963,561 | 4.52 | 9,477,754 | 96.69 | 23.94 |
| 1970 | 209,485,807 | 5.06 | 10,082,275 | 96.99 | 22.90 |
| 1965 | 199,403,532 | 7.10 | 13,227,008 | 97.81 | 21.80 |
| 1960 | 186,176,524 | 9.00 | 15,380,146 | 98.36 | 20.35 |
| 1955 | 170,796,378 | 8.23 | 12,983,338 | 98.91 | 18.67 |
| 1950 | 157,813,040 | 99.81 | 17.25 |