Canada population
35,997,830
Births this year: 3,633,182
Births today 782
Deaths this year 2,998,257
Deaths today 645
35,997,830
| Region Name | Percents | Number |
|---|---|---|
| Catholic (includes Roman Catholic, Orthodox, other Catholic) | 40.6% | 14,357,339 people |
| Protestant (includes United Church, Anglican, Baptist, Lutheran, Pentecostal, Presbyterian, other Protestant) | 20.3% | 7,178,670 people |
| other Christian | 6.3% | 2,227,863 people |
| Muslim | 3.2% | 1,131,613 people |
| Hindu | 1.5% | 530,444 people |
| Sikh | 1.4% | 495,081 people |
| Buddhist | 1.1% | 388,992 people |
| Jewish | 1% | 353,629 people |
| other | 0.6% | 212,177 people |
| none | 23.9% | 8,451,734 people |
| Ethnic groups Name | Percents | Number |
|---|---|---|
| Canadian | 32.2% | 11,386,855 people |
| English | 19.8% | 7,001,855 people |
| French | 15.5% | 5,481,250 people |
| Scottish | 14.4% | 5,092,258 people |
| Irish | 13.8% | 4,880,081 people |
| German | 9.8% | 3,465,565 people |
| Italian | 4.5% | 1,591,331 people |
| Chinese | 4.5% | 1,591,331 people |
| North American Indian | 4.2% | 1,485,242 people |
| other | 50.9% | 17,999,719 people |
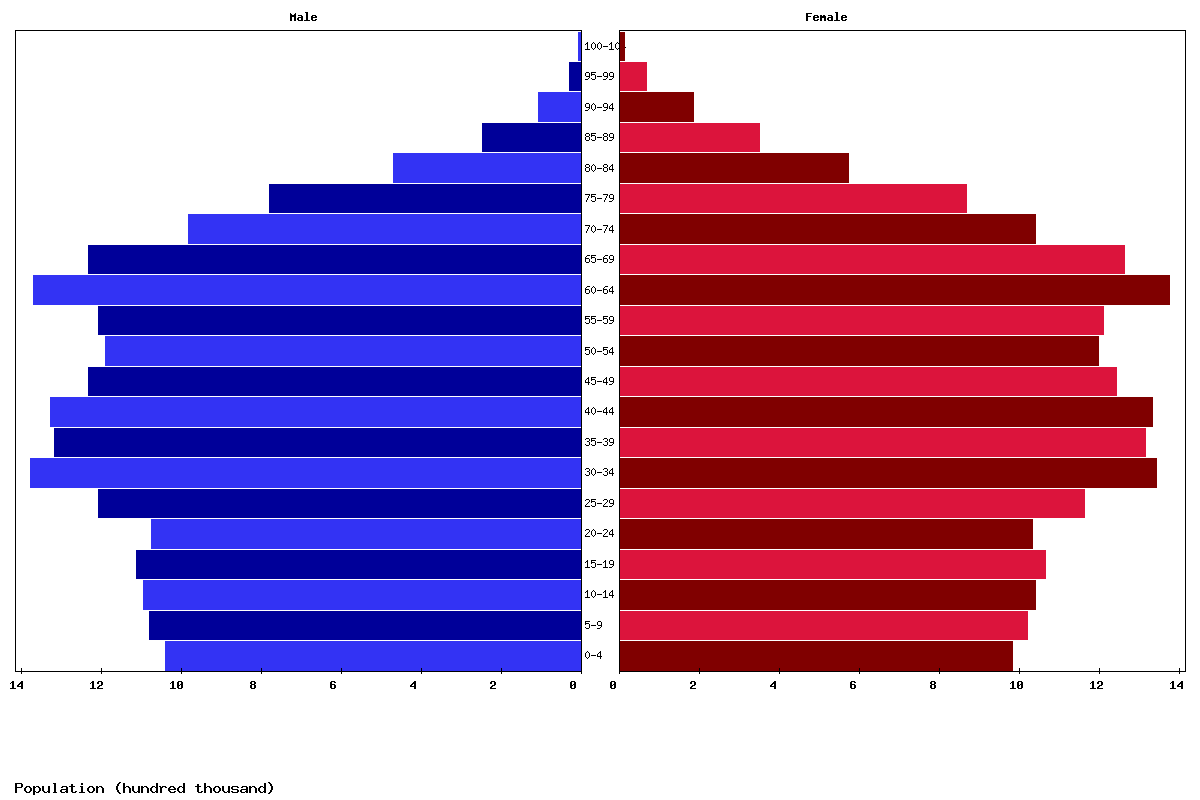
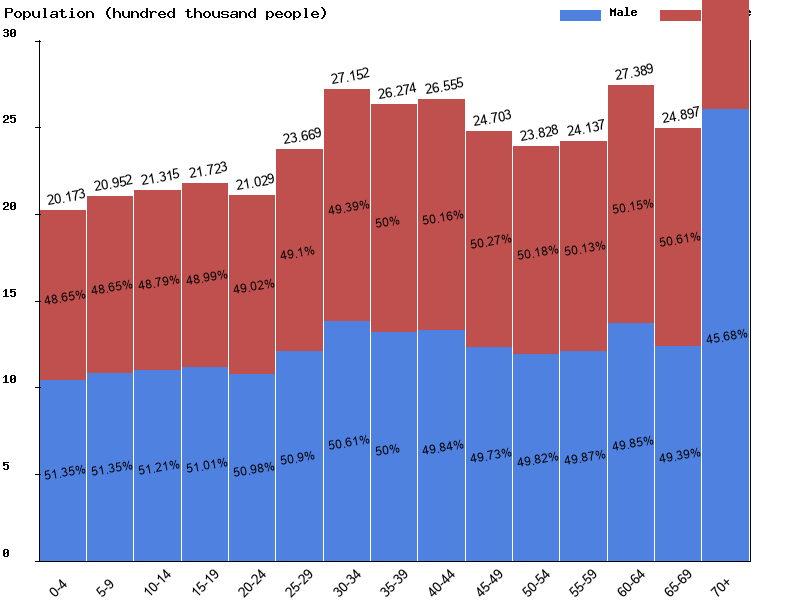
| Age | Both Sexes Population | Male Population | Female Population | Both Sexes (%) | Male (%) | Female (%) | Sex ratio (female/male) |
|---|---|---|---|---|---|---|---|
| Total | 39,065,703 | 19,411,098 | 19,654,605 | 100 | 100 | 100 | 98.8 |
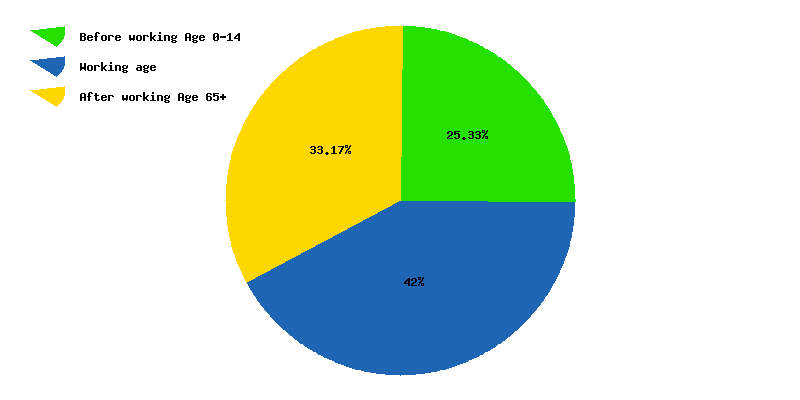
| 00-04 | 2,017,263 | 1,035,825 | 981,438 | 5.2 | 5.3 | 5 | 105.5 |
| 05-09 | 2,095,208 | 1,075,807 | 1,019,401 | 5.4 | 5.5 | 5.2 | 105.5 |
| 10-14 | 2,131,529 | 1,091,541 | 1,039,988 | 5.5 | 5.6 | 5.3 | 105 |
| 15-19 | 2,172,299 | 1,108,111 | 1,064,188 | 5.6 | 5.7 | 5.4 | 104.1 |
| 20-24 | 2,102,916 | 1,072,053 | 1,030,863 | 5.4 | 5.5 | 5.2 | 104 |
| 25-29 | 2,366,882 | 1,204,746 | 1,162,136 | 6.1 | 6.2 | 5.9 | 103.7 |
| 30-34 | 2,715,195 | 1,374,103 | 1,341,092 | 7 | 7.1 | 6.8 | 102.5 |
| 35-39 | 2,627,443 | 1,313,817 | 1,313,626 | 6.7 | 6.8 | 6.7 | 100 |
| 40-44 | 2,655,450 | 1,323,425 | 1,332,025 | 6.8 | 6.8 | 6.8 | 99.4 |
| 45-49 | 2,470,327 | 1,228,568 | 1,241,759 | 6.3 | 6.3 | 6.3 | 98.9 |
| 50-54 | 2,382,842 | 1,187,016 | 1,195,826 | 6.1 | 6.1 | 6.1 | 99.3 |
| 55-59 | 2,413,732 | 1,203,760 | 1,209,972 | 6.2 | 6.2 | 6.2 | 99.5 |
| 60-64 | 2,738,903 | 1,365,462 | 1,373,441 | 7 | 7 | 7 | 99.4 |
| 65-69 | 2,489,682 | 1,229,595 | 1,260,087 | 6.4 | 6.3 | 6.4 | 97.6 |
| 70-74 | 2,018,885 | 979,202 | 1,039,683 | 5.2 | 5 | 5.3 | 94.2 |
| 75-79 | 1,640,471 | 775,233 | 865,238 | 4.2 | 4 | 4.4 | 89.6 |
| 80-84 | 1,038,063 | 465,923 | 572,140 | 2.7 | 2.4 | 2.9 | 81.4 |
| 85-89 | 593,144 | 244,791 | 348,353 | 1.5 | 1.3 | 1.8 | 70.3 |
| 90-94 | 286,980 | 102,528 | 184,452 | 0.7 | 0.5 | 0.9 | 55.6 |
| 95-99 | 93,130 | 26,522 | 66,608 | 0.2 | 0.1 | 0.3 | 39.8 |
| 100+ | 15,359 | 3,070 | 12,289 | 0 | 0 | 0.1 | 25 |
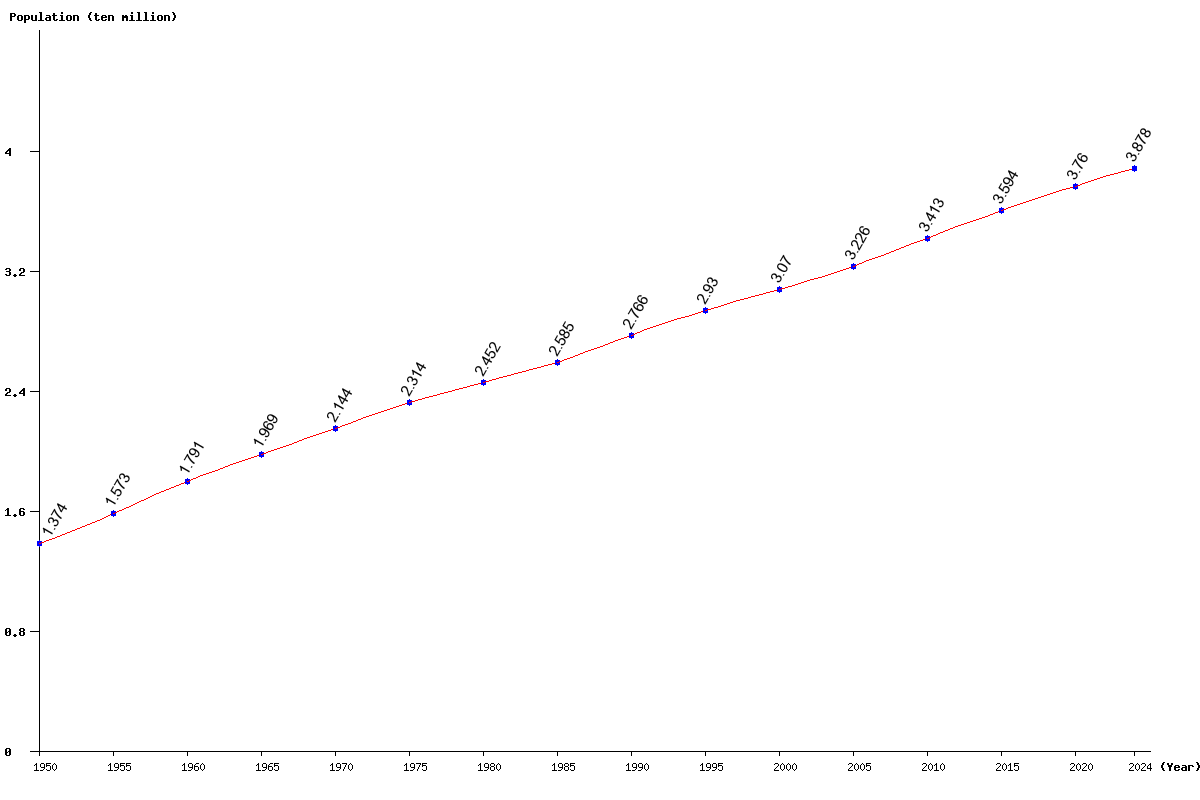
| Year | Population | Yearly % Change |
Yearly Change |
Sex ratio | Density (P/Km²) |
|---|---|---|---|---|---|
| 2025 | 39,065,703 | 0.73 | 281,266 | 98.76 | 4.30 |
| 2024 | 38,784,437 | 0.74 | 285,988 | 98.73 | 4.27 |
| 2023 | 38,498,449 | 0.76 | 291,811 | 98.71 | 4.23 |
| 2022 | 38,206,638 | 0.79 | 299,250 | 98.67 | 4.20 |
| 2021 | 37,907,388 | 0.82 | 307,819 | 98.64 | 4.17 |
| 2020 | 37,599,569 | 0.85 | 316,479 | 98.60 | 4.13 |
| 2019 | 37,283,090 | 0.88 | 324,599 | 98.56 | 4.10 |
| 2018 | 36,958,491 | 0.91 | 332,408 | 98.52 | 4.06 |
| 2017 | 36,626,083 | 0.94 | 339,705 | 98.47 | 4.03 |
| 2016 | 36,286,378 | 0.96 | 346,451 | 98.44 | 3.99 |
| 2015 | 35,939,927 | 0.99 | 352,134 | 98.41 | 3.95 |
| 2014 | 35,587,793 | 1.01 | 357,181 | 98.40 | 3.91 |
| 2013 | 35,230,612 | 1.04 | 362,461 | 98.40 | 3.87 |
| 2012 | 34,868,151 | 1.07 | 368,246 | 98.41 | 3.83 |
| 2011 | 34,499,905 | 1.10 | 373,732 | 98.42 | 3.79 |
| 2010 | 34,126,173 | 1.12 | 379,614 | 98.41 | 3.75 |
| 2005 | 32,256,333 | 5.06 | 1,554,430 | 98.26 | 3.55 |
| 2000 | 30,701,903 | 4.79 | 1,402,425 | 98.11 | 3.38 |
| 1995 | 29,299,478 | 5.92 | 1,637,038 | 98.01 | 3.22 |
| 1990 | 27,662,440 | 7.02 | 1,814,267 | 98.34 | 3.04 |
| 1985 | 25,848,173 | 5.43 | 1,332,385 | 98.63 | 2.84 |
| 1980 | 24,515,788 | 5.94 | 1,375,179 | 99.22 | 2.70 |
| 1975 | 23,140,609 | 7.94 | 1,701,409 | 100.19 | 2.54 |
| 1970 | 21,439,200 | 8.86 | 1,745,662 | 100.59 | 2.36 |
| 1965 | 19,693,538 | 9.96 | 1,784,306 | 101.13 | 2.17 |
| 1960 | 17,909,232 | 13.83 | 2,175,374 | 102.34 | 1.97 |
| 1955 | 15,733,858 | 14.54 | 1,996,861 | 102.78 | 1.73 |
| 1950 | 13,736,997 | 102.97 | 1.51 |