Virgin Islands, US population
0
Births this year: 0
Births today 0
Deaths this year 0
Deaths today 0
0
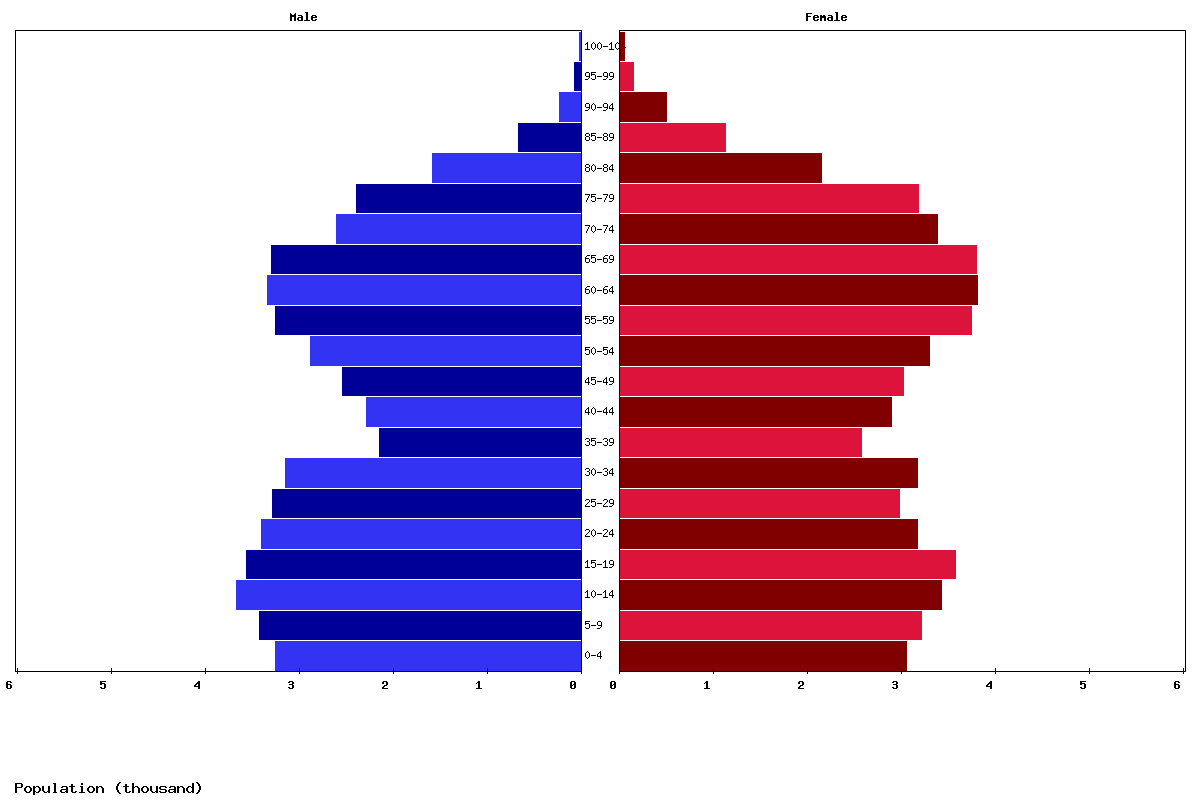
| Age | Both Sexes Population | Male Population | Female Population | Both Sexes (%) | Male (%) | Female (%) | Sex ratio (female/male) |
|---|---|---|---|---|---|---|---|
| Total | 106,920 | 50,766 | 56,154 | 100 | 100 | 100 | 90.4 |
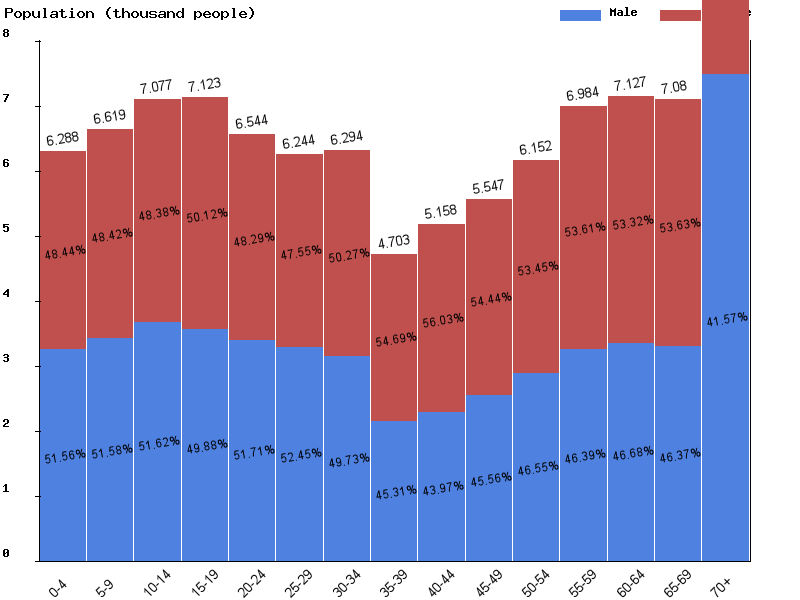
| 00-04 | 6,288 | 3,242 | 3,046 | 5.9 | 6.4 | 5.4 | 106.4 |
| 05-09 | 6,619 | 3,414 | 3,205 | 6.2 | 6.7 | 5.7 | 106.5 |
| 10-14 | 7,077 | 3,653 | 3,424 | 6.6 | 7.2 | 6.1 | 106.7 |
| 15-19 | 7,123 | 3,553 | 3,570 | 6.7 | 7 | 6.4 | 99.5 |
| 20-24 | 6,544 | 3,384 | 3,160 | 6.1 | 6.7 | 5.6 | 107.1 |
| 25-29 | 6,244 | 3,275 | 2,969 | 5.8 | 6.5 | 5.3 | 110.3 |
| 30-34 | 6,294 | 3,130 | 3,164 | 5.9 | 6.2 | 5.6 | 98.9 |
| 35-39 | 4,703 | 2,131 | 2,572 | 4.4 | 4.2 | 4.6 | 82.9 |
| 40-44 | 5,158 | 2,268 | 2,890 | 4.8 | 4.5 | 5.1 | 78.5 |
| 45-49 | 5,547 | 2,527 | 3,020 | 5.2 | 5 | 5.4 | 83.7 |
| 50-54 | 6,152 | 2,864 | 3,288 | 5.8 | 5.6 | 5.9 | 87.1 |
| 55-59 | 6,984 | 3,240 | 3,744 | 6.5 | 6.4 | 6.7 | 86.5 |
| 60-64 | 7,127 | 3,327 | 3,800 | 6.7 | 6.6 | 6.8 | 87.6 |
| 65-69 | 7,080 | 3,283 | 3,797 | 6.6 | 6.5 | 6.8 | 86.5 |
| 70-74 | 5,969 | 2,592 | 3,377 | 5.6 | 5.1 | 6 | 76.8 |
| 75-79 | 5,551 | 2,375 | 3,176 | 5.2 | 4.7 | 5.7 | 74.8 |
| 80-84 | 3,711 | 1,569 | 2,142 | 3.5 | 3.1 | 3.8 | 73.2 |
| 85-89 | 1,776 | 656 | 1,120 | 1.7 | 1.3 | 2 | 58.6 |
| 90-94 | 719 | 222 | 497 | 0.7 | 0.4 | 0.9 | 44.7 |
| 95-99 | 195 | 54 | 141 | 0.2 | 0.1 | 0.3 | 38.3 |
| 100+ | 59 | 7 | 52 | 0.1 | 0 | 0.1 | 13.5 |
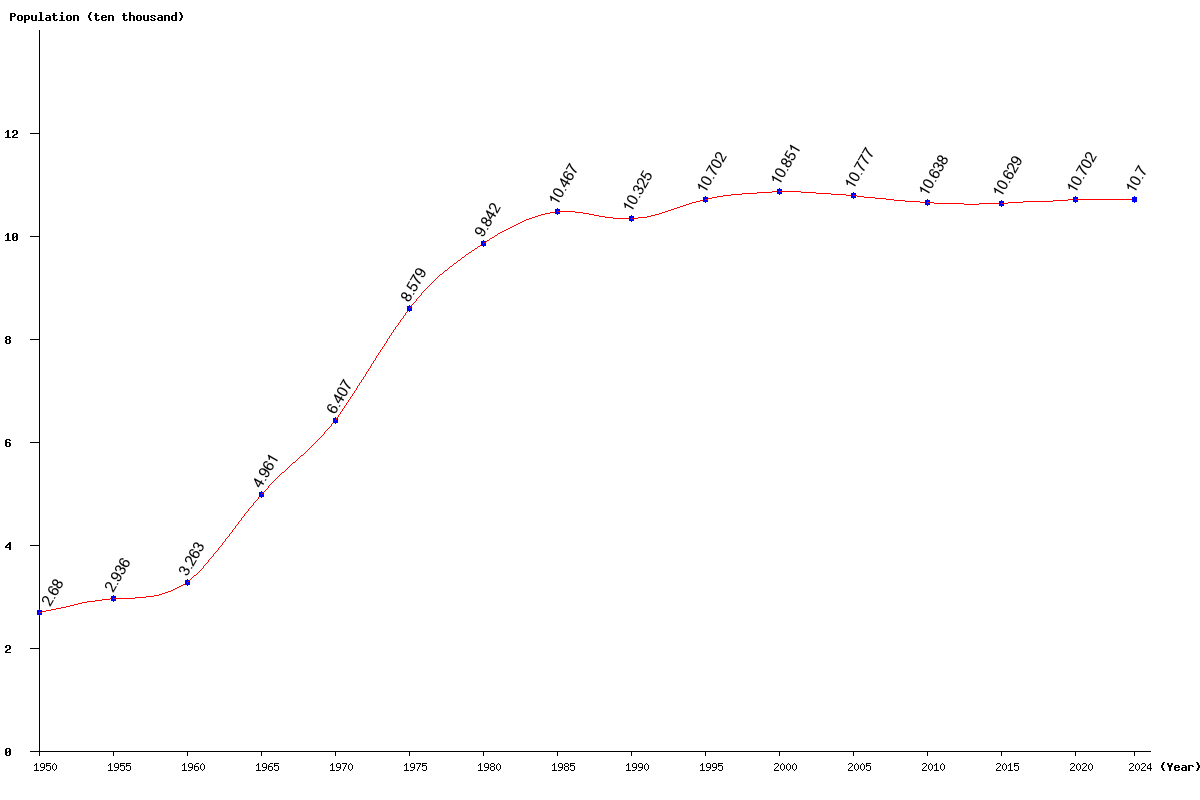
| Year | Population | Yearly % Change |
Yearly Change |
Sex ratio | Density (P/Km²) |
|---|---|---|---|---|---|
| 2025 | 106,920 | -0.08 | -82 | 90.40 | 305.49 |
| 2024 | 107,002 | -0.06 | -59 | 90.43 | 305.72 |
| 2023 | 107,061 | -0.03 | -30 | 90.46 | 305.89 |
| 2022 | 107,091 | 0.01 | 13 | 90.50 | 305.97 |
| 2021 | 107,078 | 0.06 | 63 | 90.55 | 305.94 |
| 2020 | 107,015 | 0.11 | 114 | 90.61 | 305.76 |
| 2019 | 106,901 | 0.15 | 155 | 90.67 | 305.43 |
| 2018 | 106,746 | 0.16 | 172 | 90.73 | 304.99 |
| 2017 | 106,574 | 0.15 | 159 | 90.80 | 304.50 |
| 2016 | 106,415 | 0.12 | 124 | 90.88 | 304.04 |
| 2015 | 106,291 | 0.08 | 83 | 90.98 | 303.69 |
| 2014 | 106,208 | 0.04 | 42 | 91.08 | 303.45 |
| 2013 | 106,166 | -0.01 | -8 | 91.19 | 303.33 |
| 2012 | 106,174 | -0.07 | -70 | 91.31 | 303.35 |
| 2011 | 106,244 | -0.13 | -138 | 91.42 | 303.55 |
| 2010 | 106,382 | -0.20 | -208 | 91.53 | 303.95 |
| 2005 | 107,768 | -0.68 | -743 | 91.84 | 307.91 |
| 2000 | 108,511 | 1.40 | 1,493 | 91.59 | 310.03 |
| 1995 | 107,018 | 3.65 | 3,765 | 92.21 | 305.77 |
| 1990 | 103,253 | -1.35 | -1,415 | 93.92 | 295.01 |
| 1985 | 104,668 | 6.35 | 6,245 | 93.98 | 299.05 |
| 1980 | 98,423 | 14.73 | 12,633 | 92.45 | 281.21 |
| 1975 | 85,790 | 33.90 | 21,720 | 95.58 | 245.11 |
| 1970 | 64,070 | 29.15 | 14,460 | 99.47 | 183.06 |
| 1965 | 49,610 | 52.03 | 16,978 | 99.67 | 141.74 |
| 1960 | 32,632 | 11.14 | 3,270 | 97.96 | 93.23 |
| 1955 | 29,362 | 9.58 | 2,567 | 98.16 | 83.89 |
| 1950 | 26,795 | 96.24 | 76.56 |