Vietnam population
104,629,248
Births this year: 15,008,282
Births today 3,132
Deaths this year 5,640,055
Deaths today 1,177
104,629,248
| Region Name | Percents | Number |
|---|---|---|
| Buddhist | 9.3% | 8,859,275 people |
| Catholic | 6.7% | 6,382,488 people |
| Hoa Hao | 1.5% | 1,428,915 people |
| Cao Dai | 1.1% | 1,047,871 people |
| Protestant | 0.5% | 476,305 people |
| Muslim | 0.1% | 95,261 people |
| none | 80.8% | 76,970,905 people |
| Ethnic groups Name | Percents | Number |
|---|---|---|
| Kinh (Viet) | 85.7% | 81,638,695 people |
| Tay | 1.9% | 1,809,959 people |
| Thai | 1.8% | 1,714,698 people |
| Muong | 1.5% | 1,428,915 people |
| Khmer | 1.5% | 1,428,915 people |
| Mong | 1.2% | 1,143,132 people |
| Nung | 1.1% | 1,047,871 people |
| others | 5.3% | 5,048,834 people |
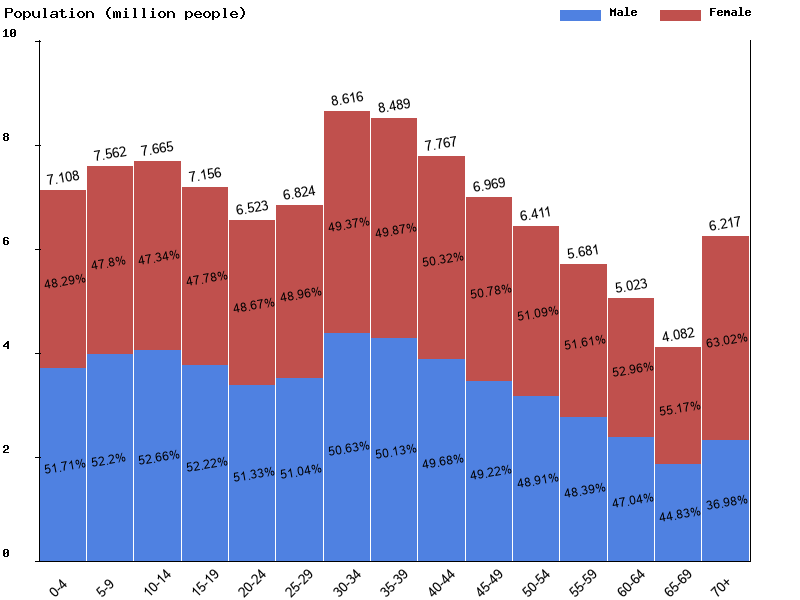
| Age | Both Sexes Population | Male Population | Female Population | Both Sexes (%) | Male (%) | Female (%) | Sex ratio (female/male) |
|---|---|---|---|---|---|---|---|
| Total | 102,092,604 | 50,510,945 | 51,581,659 | 100 | 100 | 100 | 97.9 |
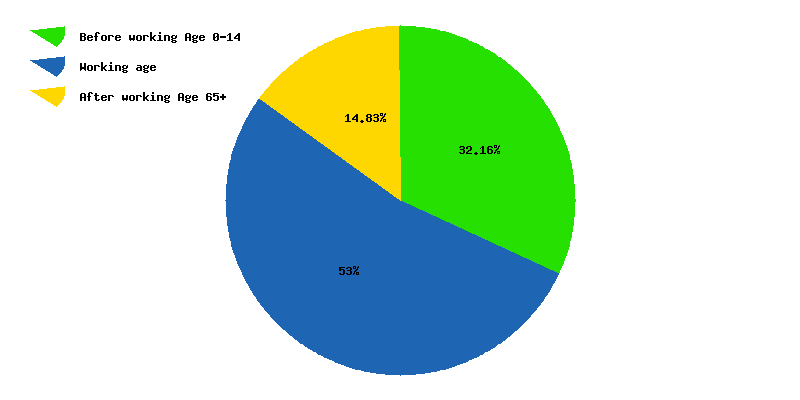
| 00-04 | 7,108,207 | 3,676,007 | 3,432,200 | 7 | 7.3 | 6.7 | 107.1 |
| 05-09 | 7,562,468 | 3,947,755 | 3,614,713 | 7.4 | 7.8 | 7 | 109.2 |
| 10-14 | 7,664,610 | 4,036,037 | 3,628,573 | 7.5 | 8 | 7 | 111.2 |
| 15-19 | 7,156,328 | 3,737,307 | 3,419,021 | 7 | 7.4 | 6.6 | 109.3 |
| 20-24 | 6,522,924 | 3,348,039 | 3,174,885 | 6.4 | 6.6 | 6.2 | 105.5 |
| 25-29 | 6,823,570 | 3,482,786 | 3,340,784 | 6.7 | 6.9 | 6.5 | 104.3 |
| 30-34 | 8,616,078 | 4,362,212 | 4,253,866 | 8.4 | 8.6 | 8.2 | 102.5 |
| 35-39 | 8,488,637 | 4,255,708 | 4,232,929 | 8.3 | 8.4 | 8.2 | 100.5 |
| 40-44 | 7,766,842 | 3,858,819 | 3,908,023 | 7.6 | 7.6 | 7.6 | 98.7 |
| 45-49 | 6,968,817 | 3,430,011 | 3,538,806 | 6.8 | 6.8 | 6.9 | 96.9 |
| 50-54 | 6,410,987 | 3,135,499 | 3,275,488 | 6.3 | 6.2 | 6.4 | 95.7 |
| 55-59 | 5,681,409 | 2,749,373 | 2,932,036 | 5.6 | 5.4 | 5.7 | 93.8 |
| 60-64 | 5,023,429 | 2,362,882 | 2,660,547 | 4.9 | 4.7 | 5.2 | 88.8 |
| 65-69 | 4,081,720 | 1,829,652 | 2,252,068 | 4 | 3.6 | 4.4 | 81.2 |
| 70-74 | 2,739,089 | 1,152,026 | 1,587,063 | 2.7 | 2.3 | 3.1 | 72.6 |
| 75-79 | 1,424,620 | 532,757 | 891,863 | 1.4 | 1.1 | 1.7 | 59.7 |
| 80-84 | 895,854 | 302,910 | 592,944 | 0.9 | 0.6 | 1.1 | 51.1 |
| 85-89 | 613,529 | 181,488 | 432,041 | 0.6 | 0.4 | 0.8 | 42 |
| 90-94 | 370,767 | 93,925 | 276,842 | 0.4 | 0.2 | 0.5 | 33.9 |
| 95-99 | 133,553 | 28,643 | 104,910 | 0.1 | 0.1 | 0.2 | 27.3 |
| 100+ | 39,166 | 7,109 | 32,057 | 0 | 0 | 0.1 | 22.2 |

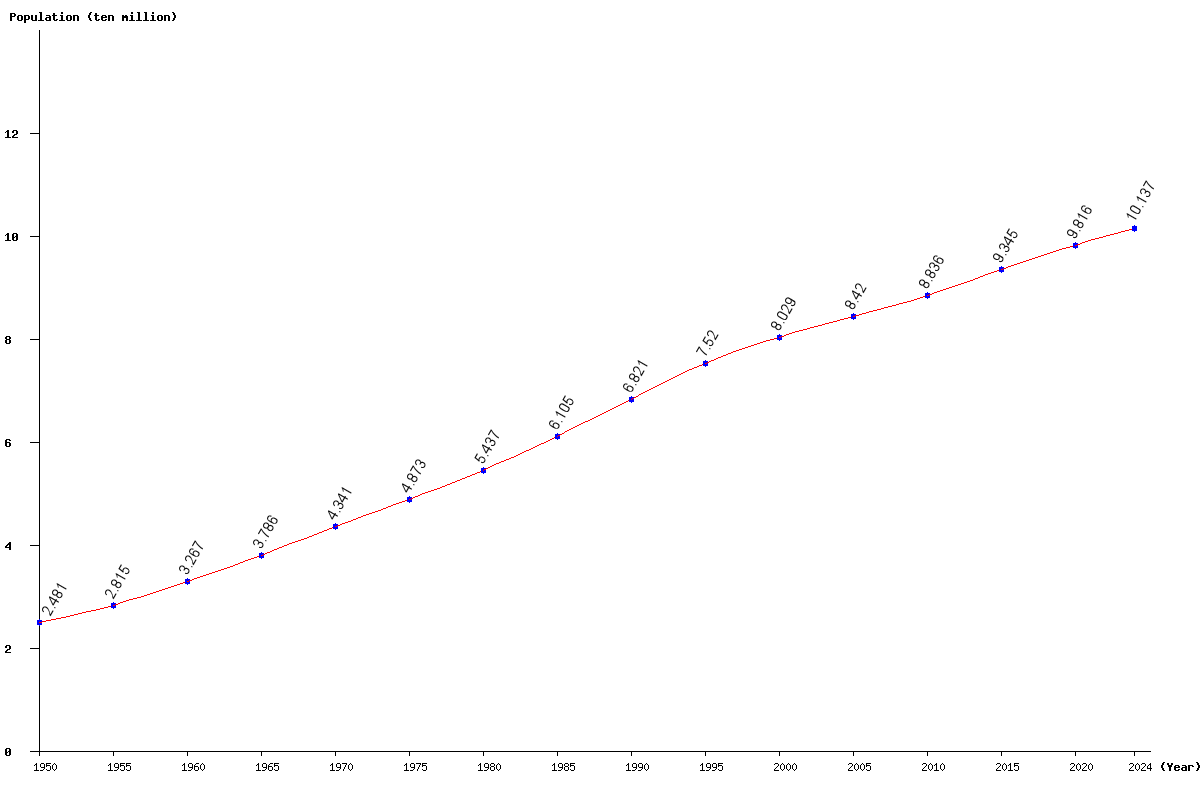
| Year | Population | Yearly % Change |
Yearly Change |
Sex ratio | Density (P/Km²) |
|---|---|---|---|---|---|
| 2025 | 102,092,604 | 0.71 | 719,565 | 97.92 | 329.26 |
| 2024 | 101,373,039 | 0.75 | 753,035 | 97.97 | 326.94 |
| 2023 | 100,620,004 | 0.79 | 787,034 | 98.00 | 324.51 |
| 2022 | 99,832,970 | 0.83 | 821,286 | 98.02 | 321.97 |
| 2021 | 99,011,684 | 0.87 | 855,067 | 98.03 | 319.32 |
| 2020 | 98,156,617 | 0.91 | 885,839 | 98.03 | 316.56 |
| 2019 | 97,270,778 | 0.95 | 914,034 | 98.02 | 313.71 |
| 2018 | 96,356,744 | 0.99 | 942,104 | 98.00 | 310.76 |
| 2017 | 95,414,640 | 1.03 | 970,440 | 97.97 | 307.72 |
| 2016 | 94,444,200 | 1.07 | 996,599 | 97.93 | 304.59 |
| 2015 | 93,447,601 | 1.11 | 1,024,263 | 97.89 | 301.38 |
| 2014 | 92,423,338 | 1.14 | 1,044,586 | 97.83 | 298.07 |
| 2013 | 91,378,752 | 1.15 | 1,043,205 | 97.77 | 294.70 |
| 2012 | 90,335,547 | 1.13 | 1,013,644 | 97.70 | 291.34 |
| 2011 | 89,321,903 | 1.09 | 964,128 | 97.62 | 288.07 |
| 2010 | 88,357,775 | 1.04 | 908,754 | 97.53 | 284.96 |
| 2005 | 84,203,817 | 4.88 | 3,918,254 | 97.04 | 271.56 |
| 2000 | 80,285,563 | 6.76 | 5,086,588 | 97.10 | 258.93 |
| 1995 | 75,198,975 | 10.25 | 6,989,371 | 97.14 | 242.52 |
| 1990 | 68,209,604 | 11.73 | 7,160,234 | 96.99 | 219.98 |
| 1985 | 61,049,370 | 12.28 | 6,676,852 | 96.79 | 196.89 |
| 1980 | 54,372,518 | 11.58 | 5,643,121 | 96.60 | 175.36 |
| 1975 | 48,729,397 | 12.26 | 5,322,106 | 96.57 | 157.16 |
| 1970 | 43,407,291 | 14.65 | 5,547,277 | 97.21 | 139.99 |
| 1965 | 37,860,014 | 15.88 | 5,189,391 | 97.40 | 122.10 |
| 1960 | 32,670,623 | 16.07 | 4,522,838 | 97.35 | 105.37 |
| 1955 | 28,147,785 | 13.45 | 3,337,882 | 97.33 | 90.78 |
| 1950 | 24,809,903 | 97.51 | 80.01 |