Uruguay population
3,341,978
Births this year: 0
Births today 0
Deaths this year 9,038
Deaths today 0
3,341,978
| Region Name | Percents | Number |
|---|---|---|
| Roman Catholic | 47.1% | 1,578,329 people |
| non-Catholic Christians | 11.1% | 371,963 people |
| nondenominational | 23.2% | 777,436 people |
| Jewish | 0.3% | 10,053 people |
| atheist or agnostic | 17.2% | 576,375 people |
| other | 1.1% | 36,861 people |
| Ethnic groups Name | Percents | Number |
|---|---|---|
| white | 88% | 2,948,894 people |
| mestizo | 8% | 268,081 people |
| black | 4% | 134,041 people |
| 0 people |
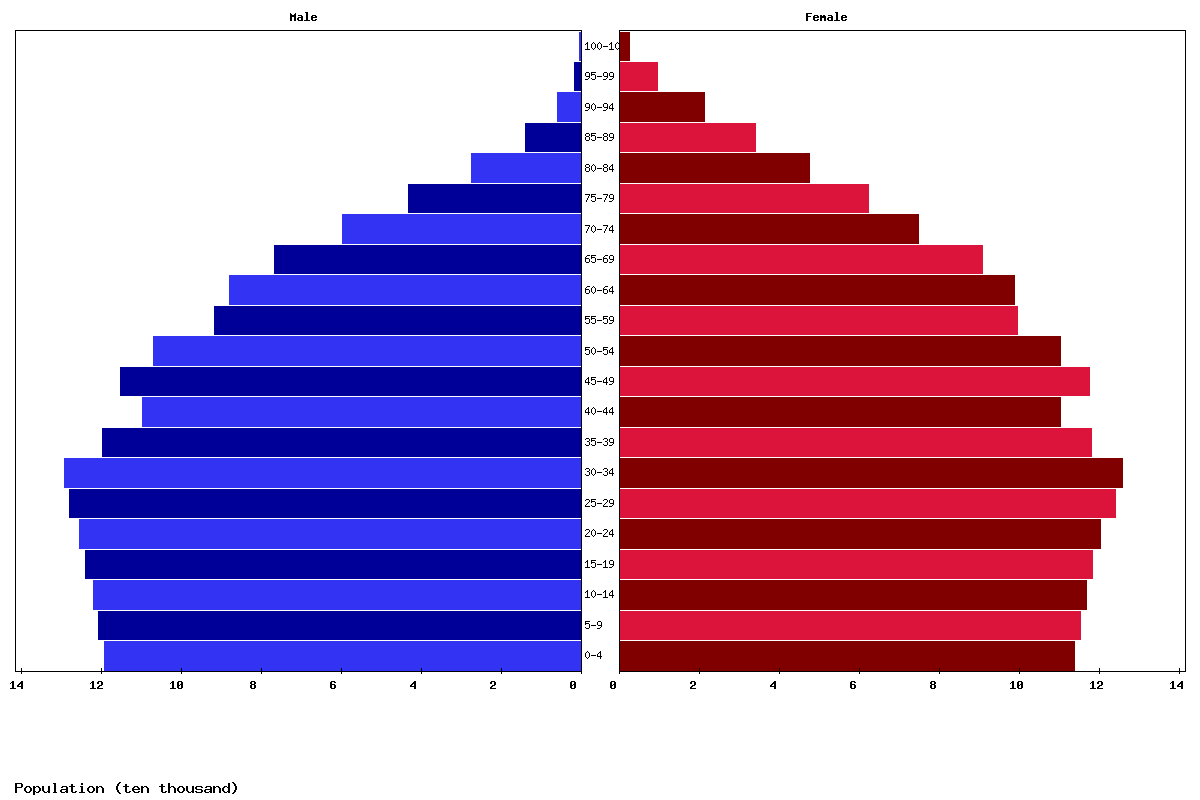
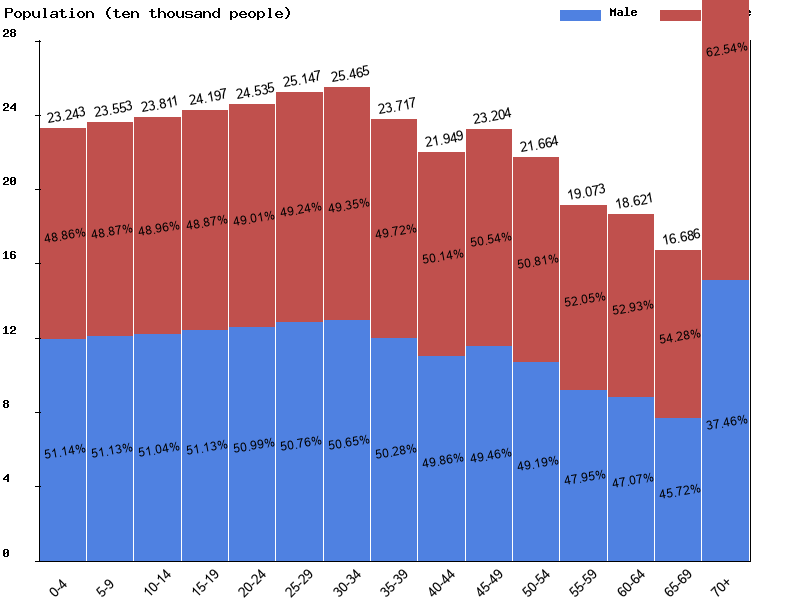
| Age | Both Sexes Population | Male Population | Female Population | Both Sexes (%) | Male (%) | Female (%) | Sex ratio (female/male) |
|---|---|---|---|---|---|---|---|
| Total | 3,549,866 | 1,721,992 | 1,827,874 | 100 | 100 | 100 | 94.2 |
| 00-04 | 232,426 | 118,872 | 113,554 | 6.5 | 6.9 | 6.2 | 104.7 |
| 05-09 | 235,528 | 120,428 | 115,100 | 6.6 | 7 | 6.3 | 104.6 |
| 10-14 | 238,109 | 121,542 | 116,567 | 6.7 | 7.1 | 6.4 | 104.3 |
| 15-19 | 241,967 | 123,725 | 118,242 | 6.8 | 7.2 | 6.5 | 104.6 |
| 20-24 | 245,345 | 125,103 | 120,242 | 6.9 | 7.3 | 6.6 | 104 |
| 25-29 | 251,473 | 127,636 | 123,837 | 7.1 | 7.4 | 6.8 | 103.1 |
| 30-34 | 254,654 | 128,986 | 125,668 | 7.2 | 7.5 | 6.9 | 102.6 |
| 35-39 | 237,170 | 119,254 | 117,916 | 6.7 | 6.9 | 6.5 | 101.1 |
| 40-44 | 219,488 | 109,431 | 110,057 | 6.2 | 6.4 | 6 | 99.4 |
| 45-49 | 232,037 | 114,770 | 117,267 | 6.5 | 6.7 | 6.4 | 97.9 |
| 50-54 | 216,635 | 106,563 | 110,072 | 6.1 | 6.2 | 6 | 96.8 |
| 55-59 | 190,732 | 91,451 | 99,281 | 5.4 | 5.3 | 5.4 | 92.1 |
| 60-64 | 186,212 | 87,653 | 98,559 | 5.2 | 5.1 | 5.4 | 88.9 |
| 65-69 | 166,858 | 76,280 | 90,578 | 4.7 | 4.4 | 5 | 84.2 |
| 70-74 | 134,068 | 59,395 | 74,673 | 3.8 | 3.4 | 4.1 | 79.5 |
| 75-79 | 104,867 | 42,810 | 62,057 | 3 | 2.5 | 3.4 | 69 |
| 80-84 | 74,496 | 27,070 | 47,426 | 2.1 | 1.6 | 2.6 | 57.1 |
| 85-89 | 47,545 | 13,735 | 33,810 | 1.3 | 0.8 | 1.8 | 40.6 |
| 90-94 | 26,897 | 5,735 | 21,162 | 0.8 | 0.3 | 1.2 | 27.1 |
| 95-99 | 10,704 | 1,367 | 9,337 | 0.3 | 0.1 | 0.5 | 14.6 |
| 100+ | 2,655 | 186 | 2,469 | 0.1 | 0 | 0.1 | 7.5 |
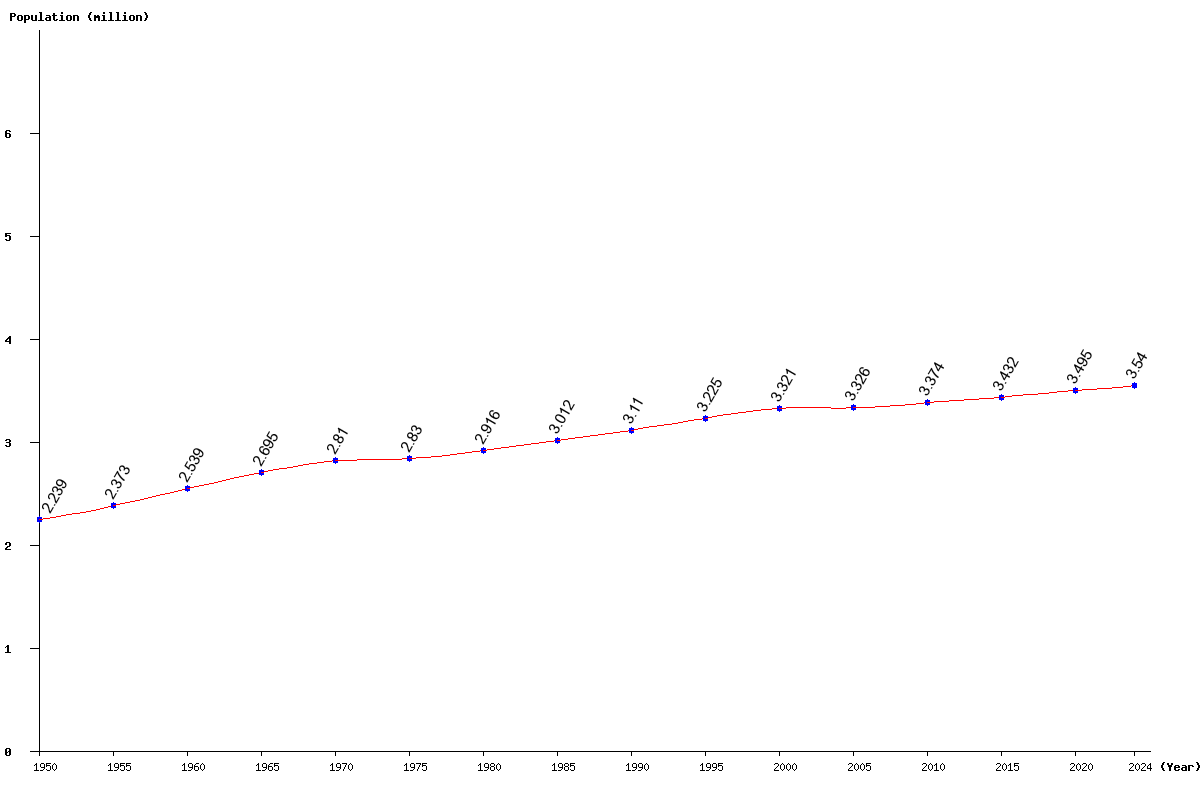
| Year | Population | Yearly % Change |
Yearly Change |
Sex ratio | Density (P/Km²) |
|---|---|---|---|---|---|
| 2025 | 3,549,866 | 0.29 | 10,273 | 94.21 | 20.28 |
| 2024 | 3,539,593 | 0.30 | 10,585 | 94.11 | 20.22 |
| 2023 | 3,529,008 | 0.31 | 10,949 | 94.01 | 20.16 |
| 2022 | 3,518,059 | 0.32 | 11,385 | 93.91 | 20.10 |
| 2021 | 3,506,674 | 0.34 | 11,856 | 93.81 | 20.04 |
| 2020 | 3,494,818 | 0.35 | 12,332 | 93.72 | 19.97 |
| 2019 | 3,482,486 | 0.37 | 12,715 | 93.63 | 19.90 |
| 2018 | 3,469,771 | 0.37 | 12,894 | 93.54 | 19.82 |
| 2017 | 3,456,877 | 0.37 | 12,806 | 93.45 | 19.75 |
| 2016 | 3,444,071 | 0.36 | 12,516 | 93.38 | 19.68 |
| 2015 | 3,431,555 | 0.35 | 12,039 | 93.31 | 19.61 |
| 2014 | 3,419,516 | 0.34 | 11,547 | 93.25 | 19.54 |
| 2013 | 3,407,969 | 0.33 | 11,216 | 93.20 | 19.47 |
| 2012 | 3,396,753 | 0.33 | 11,143 | 93.16 | 19.41 |
| 2011 | 3,385,610 | 0.33 | 11,196 | 93.14 | 19.34 |
| 2010 | 3,374,414 | 0.35 | 11,653 | 93.13 | 19.28 |
| 2005 | 3,325,608 | 0.13 | 4,366 | 93.30 | 19.00 |
| 2000 | 3,321,242 | 2.99 | 96,435 | 93.79 | 18.98 |
| 1995 | 3,224,807 | 3.69 | 114,820 | 93.96 | 18.43 |
| 1990 | 3,109,987 | 3.26 | 98,080 | 94.19 | 17.77 |
| 1985 | 3,011,907 | 3.30 | 96,132 | 95.19 | 17.21 |
| 1980 | 2,915,775 | 3.02 | 85,603 | 96.28 | 16.66 |
| 1975 | 2,830,172 | 0.73 | 20,373 | 98.12 | 16.17 |
| 1970 | 2,809,799 | 4.28 | 115,264 | 98.82 | 16.05 |
| 1965 | 2,694,535 | 6.14 | 155,884 | 99.45 | 15.40 |
| 1960 | 2,538,651 | 7.00 | 166,084 | 100.15 | 14.50 |
| 1955 | 2,372,567 | 5.99 | 134,061 | 101.17 | 13.56 |
| 1950 | 2,238,506 | 102.36 | 12.79 |