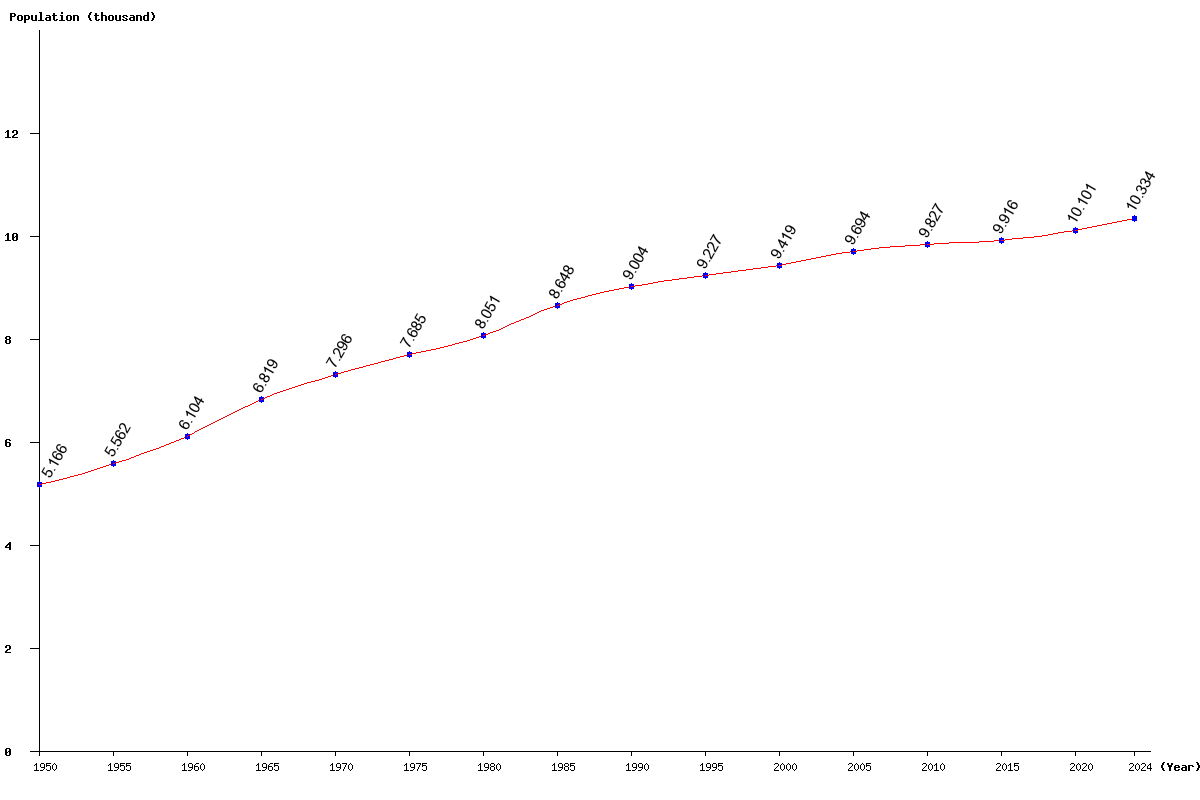
Tuvalu population
12,552
Births this year: 2,494
Births today 1
Deaths this year 901
Deaths today 0
12,552
| Region Name | Percents | Number |
|---|---|---|
| Protestant (Church of Tuvalu (Congregationalist), Seventh-Day Adventist) | 98.4% | 10,784 people |
| other | 1.6% | 175 people |
| Ethnic groups Name | Percents | Number |
|---|---|---|
| Polynesian | 96% | 10,521 people |
| Micronesian | 4% | 438 people |
| Year | Population | Yearly % Change |
Yearly Change |
Sex ratio | Density (P/Km²) |
|---|---|---|---|---|---|
| 2025 | 10,399 | 0.63 | 65 | 99.36 | 346.63 |
| 2024 | 10,334 | 0.62 | 64 | 99.31 | 344.47 |
| 2023 | 10,270 | 0.59 | 60 | 99.26 | 342.33 |
| 2022 | 10,210 | 0.57 | 58 | 99.21 | 340.33 |
| 2021 | 10,152 | 0.50 | 51 | 99.15 | 338.40 |
| 2020 | 10,101 | 0.47 | 47 | 99.10 | 336.70 |
| 2019 | 10,054 | 0.42 | 42 | 99.04 | 335.13 |
| 2018 | 10,012 | 0.37 | 37 | 98.98 | 333.73 |
| 2017 | 9,975 | 0.32 | 32 | 98.92 | 332.50 |
| 2016 | 9,943 | 0.27 | 27 | 98.86 | 331.43 |
| 2015 | 9,916 | 0.23 | 23 | 98.80 | 330.53 |
| 2014 | 9,893 | 0.17 | 17 | 98.76 | 329.77 |
| 2013 | 9,876 | 0.16 | 16 | 98.71 | 329.20 |
| 2012 | 9,860 | 0.16 | 16 | 98.68 | 328.67 |
| 2011 | 9,844 | 0.17 | 17 | 98.65 | 328.13 |
| 2010 | 9,827 | 0.19 | 19 | 98.62 | 327.57 |
| 2005 | 9,694 | 2.92 | 275 | 98.59 | 323.13 |
| 2000 | 9,419 | 2.08 | 192 | 99.01 | 313.97 |
| 1995 | 9,227 | 2.48 | 223 | 98.45 | 307.57 |
| 1990 | 9,004 | 4.12 | 356 | 98.12 | 300.13 |
| 1985 | 8,648 | 7.42 | 597 | 97.83 | 288.27 |
| 1980 | 8,051 | 4.76 | 366 | 97.48 | 268.37 |
| 1975 | 7,685 | 5.33 | 389 | 97.13 | 256.17 |
| 1970 | 7,296 | 7.00 | 477 | 96.76 | 243.20 |
| 1965 | 6,819 | 11.71 | 715 | 96.39 | 227.30 |
| 1960 | 6,104 | 9.74 | 542 | 96.02 | 203.47 |
| 1955 | 5,562 | 7.67 | 396 | 95.62 | 185.40 |
| 1950 | 5,166 | 95.23 | 172.20 |
