Trinidad and Tobago population
1,272,768
Births this year: 155,679
Births today 2
Deaths this year 103,390
Deaths today 1
1,272,768
| Region Name | Percents | Number |
|---|---|---|
| Protestant | 32.1% | 391,774 people |
| Roman Catholic | 21.6% | 263,623 people |
| Hindu | 18.2% | 222,127 people |
| Muslim | 5% | 61,024 people |
| other | 23.1% | 281,931 people |
| Ethnic groups Name | Percents | Number |
|---|---|---|
| East Indian | 35.4% | 432,050 people |
| African | 34.2% | 417,404 people |
| mixed - other | 15.3% | 186,733 people |
| mixed African/East Indian | 7.7% | 93,977 people |
| other | 1.3% | 15,866 people |
| unspecified | 6.2% | 75,670 people |
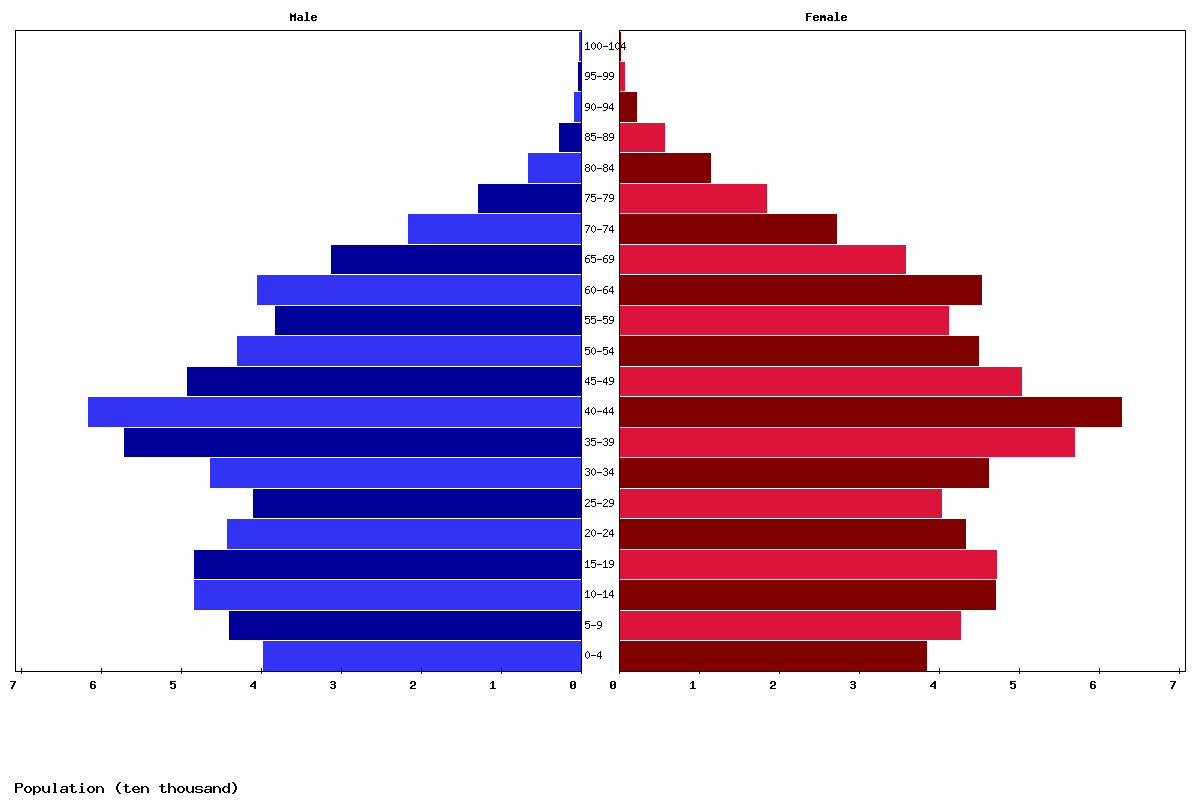
| Age | Both Sexes Population | Male Population | Female Population | Both Sexes (%) | Male (%) | Female (%) | Sex ratio (female/male) |
|---|---|---|---|---|---|---|---|
| Total | 1,380,348 | 674,620 | 705,728 | 100 | 100 | 100 | 95.6 |
| 00-04 | 77,916 | 39,581 | 38,335 | 5.6 | 5.9 | 5.4 | 103.3 |
| 05-09 | 86,477 | 43,869 | 42,608 | 6.3 | 6.5 | 6 | 103 |
| 10-14 | 95,116 | 48,219 | 46,897 | 6.9 | 7.1 | 6.6 | 102.8 |
| 15-19 | 95,199 | 48,170 | 47,029 | 6.9 | 7.1 | 6.7 | 102.4 |
| 20-24 | 87,228 | 44,065 | 43,163 | 6.3 | 6.5 | 6.1 | 102.1 |
| 25-29 | 80,957 | 40,753 | 40,204 | 5.9 | 6 | 5.7 | 101.4 |
| 30-34 | 92,253 | 46,222 | 46,031 | 6.7 | 6.9 | 6.5 | 100.4 |
| 35-39 | 113,734 | 56,891 | 56,843 | 8.2 | 8.4 | 8.1 | 100.1 |
| 40-44 | 124,094 | 61,429 | 62,665 | 9 | 9.1 | 8.9 | 98 |
| 45-49 | 99,280 | 49,102 | 50,178 | 7.2 | 7.3 | 7.1 | 97.9 |
| 50-54 | 87,648 | 42,847 | 44,801 | 6.3 | 6.4 | 6.3 | 95.6 |
| 55-59 | 79,014 | 38,006 | 41,008 | 5.7 | 5.6 | 5.8 | 92.7 |
| 60-64 | 85,508 | 40,299 | 45,209 | 6.2 | 6 | 6.4 | 89.1 |
| 65-69 | 66,674 | 31,010 | 35,664 | 4.8 | 4.6 | 5.1 | 87 |
| 70-74 | 48,516 | 21,460 | 27,056 | 3.5 | 3.2 | 3.8 | 79.3 |
| 75-79 | 31,081 | 12,723 | 18,358 | 2.3 | 1.9 | 2.6 | 69.3 |
| 80-84 | 17,775 | 6,440 | 11,335 | 1.3 | 1 | 1.6 | 56.8 |
| 85-89 | 8,151 | 2,601 | 5,550 | 0.6 | 0.4 | 0.8 | 46.9 |
| 90-94 | 2,821 | 745 | 2,076 | 0.2 | 0.1 | 0.3 | 35.9 |
| 95-99 | 771 | 165 | 606 | 0.1 | 0 | 0.1 | 27.2 |
| 100+ | 135 | 23 | 112 | 0 | 0 | 0 | 20.5 |
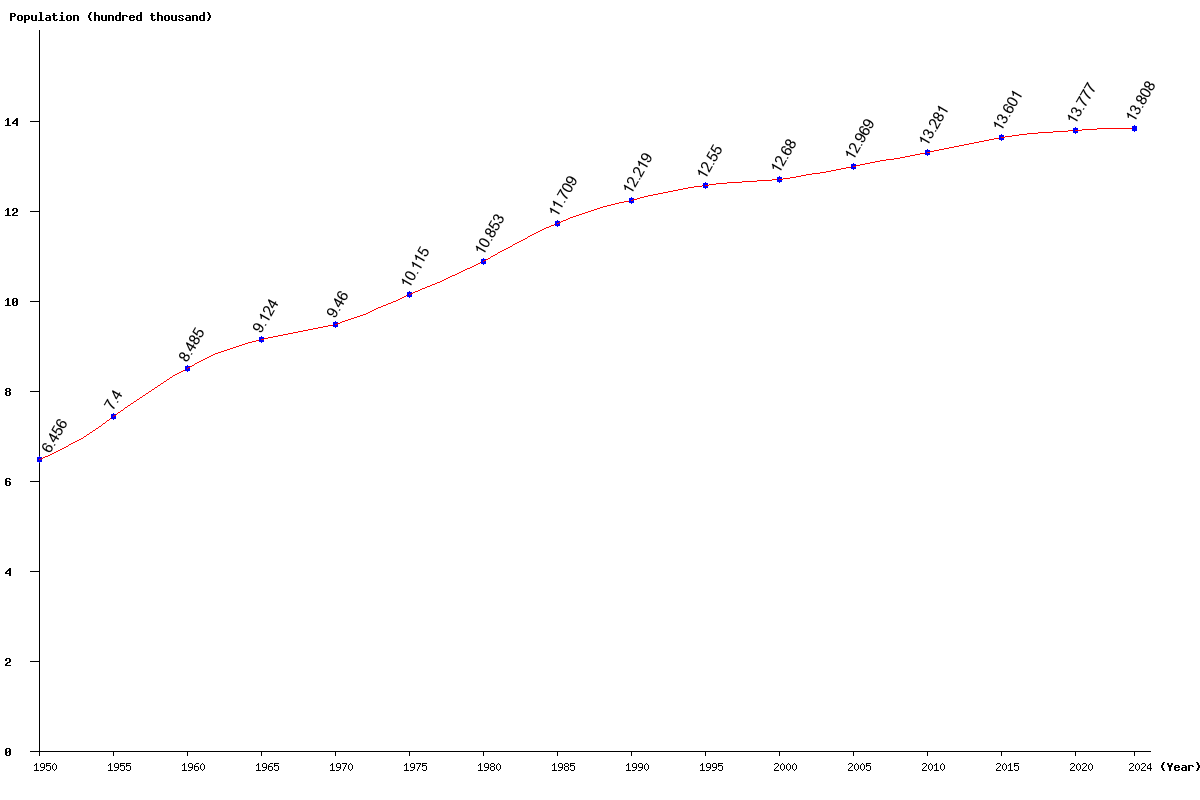
| Year | Population | Yearly % Change |
Yearly Change |
Sex ratio | Density (P/Km²) |
|---|---|---|---|---|---|
| 2025 | 1,380,348 | -0.03 | -477 | 95.59 | 269.07 |
| 2024 | 1,380,825 | -0.00 | -40 | 95.79 | 269.17 |
| 2023 | 1,380,865 | 0.03 | 456 | 95.99 | 269.17 |
| 2022 | 1,380,409 | 0.07 | 1,023 | 96.19 | 269.09 |
| 2021 | 1,379,386 | 0.12 | 1,639 | 96.38 | 268.89 |
| 2020 | 1,377,747 | 0.16 | 2,249 | 96.57 | 268.57 |
| 2019 | 1,375,498 | 0.21 | 2,850 | 96.75 | 268.13 |
| 2018 | 1,372,648 | 0.25 | 3,491 | 96.92 | 267.57 |
| 2017 | 1,369,157 | 0.31 | 4,184 | 97.09 | 266.89 |
| 2016 | 1,364,973 | 0.36 | 4,885 | 97.25 | 266.08 |
| 2015 | 1,360,088 | 0.41 | 5,605 | 97.40 | 265.12 |
| 2014 | 1,354,483 | 0.46 | 6,243 | 97.54 | 264.03 |
| 2013 | 1,348,240 | 0.50 | 6,661 | 97.67 | 262.81 |
| 2012 | 1,341,579 | 0.51 | 6,789 | 97.79 | 261.52 |
| 2011 | 1,334,790 | 0.50 | 6,695 | 97.89 | 260.19 |
| 2010 | 1,328,095 | 0.49 | 6,471 | 97.98 | 258.89 |
| 2005 | 1,296,933 | 2.28 | 28,953 | 98.31 | 252.81 |
| 2000 | 1,267,980 | 1.03 | 12,979 | 98.94 | 247.17 |
| 1995 | 1,255,001 | 2.71 | 33,097 | 99.17 | 244.64 |
| 1990 | 1,221,904 | 4.35 | 50,969 | 99.24 | 238.19 |
| 1985 | 1,170,935 | 7.89 | 85,627 | 98.87 | 228.25 |
| 1980 | 1,085,308 | 7.30 | 73,821 | 98.77 | 211.56 |
| 1975 | 1,011,487 | 6.92 | 65,491 | 98.45 | 197.17 |
| 1970 | 945,996 | 3.68 | 33,577 | 98.57 | 184.40 |
| 1965 | 912,419 | 7.54 | 63,938 | 99.53 | 177.86 |
| 1960 | 848,481 | 14.65 | 108,445 | 100.73 | 165.40 |
| 1955 | 740,036 | 14.62 | 94,408 | 100.91 | 144.26 |
| 1950 | 645,628 | 100.71 | 125.85 |