Sri Lanka population
24
Births this year: 3
Births today 0
Deaths this year 1
Deaths today 0
24
| Region Name | Percents | Number |
|---|---|---|
| Buddhist (official) | 69.1% | 15 people |
| Muslim | 7.6% | 2 people |
| Hindu | 7.1% | 2 people |
| Christian | 6.2% | 1 people |
| unspecified | 10% | 2 people |
| Ethnic groups Name | Percents | Number |
|---|---|---|
| Sinhalese | 73.8% | 16 people |
| Sri Lankan Moors | 7.2% | 2 people |
| Indian Tamil | 4.6% | 1 people |
| Sri Lankan Tamil | 3.9% | 1 people |
| other | 0.5% | 0 people |
| unspecified | 10% | 2 people |
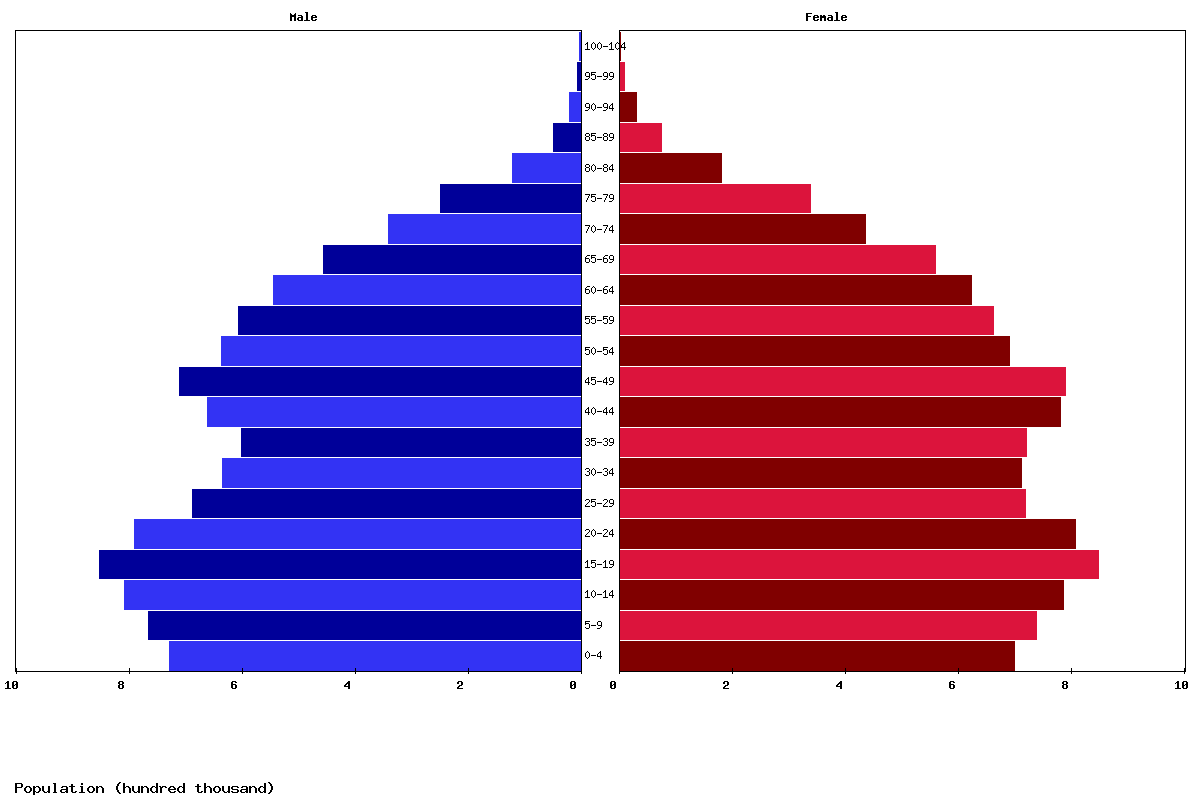
| Age | Both Sexes Population | Male Population | Female Population | Both Sexes (%) | Male (%) | Female (%) | Sex ratio (female/male) |
|---|---|---|---|---|---|---|---|
| Total | 21,417,175 | 10,233,684 | 11,183,491 | 100 | 100 | 100 | 91.5 |
| 00-04 | 1,425,452 | 726,415 | 699,037 | 6.7 | 7.1 | 6.3 | 103.9 |
| 05-09 | 1,501,716 | 764,247 | 737,469 | 7 | 7.5 | 6.6 | 103.6 |
| 10-14 | 1,591,773 | 805,933 | 785,840 | 7.4 | 7.9 | 7 | 102.6 |
| 15-19 | 1,697,245 | 850,531 | 846,714 | 7.9 | 8.3 | 7.6 | 100.5 |
| 20-24 | 1,593,697 | 788,140 | 805,557 | 7.4 | 7.7 | 7.2 | 97.8 |
| 25-29 | 1,403,172 | 685,768 | 717,404 | 6.6 | 6.7 | 6.4 | 95.6 |
| 30-34 | 1,343,780 | 633,283 | 710,497 | 6.3 | 6.2 | 6.4 | 89.1 |
| 35-39 | 1,318,625 | 598,343 | 720,282 | 6.2 | 5.8 | 6.4 | 83.1 |
| 40-44 | 1,437,594 | 658,806 | 778,788 | 6.7 | 6.4 | 7 | 84.6 |
| 45-49 | 1,496,557 | 708,103 | 788,454 | 7 | 6.9 | 7.1 | 89.8 |
| 50-54 | 1,324,018 | 634,802 | 689,216 | 6.2 | 6.2 | 6.2 | 92.1 |
| 55-59 | 1,265,483 | 604,249 | 661,234 | 5.9 | 5.9 | 5.9 | 91.4 |
| 60-64 | 1,164,861 | 542,890 | 621,971 | 5.4 | 5.3 | 5.6 | 87.3 |
| 65-69 | 1,012,860 | 454,634 | 558,226 | 4.7 | 4.4 | 5 | 81.4 |
| 70-74 | 773,690 | 339,550 | 434,140 | 3.6 | 3.3 | 3.9 | 78.2 |
| 75-79 | 585,172 | 247,509 | 337,663 | 2.7 | 2.4 | 3 | 73.3 |
| 80-84 | 299,031 | 119,125 | 179,906 | 1.4 | 1.2 | 1.6 | 66.2 |
| 85-89 | 119,659 | 46,886 | 72,773 | 0.6 | 0.5 | 0.7 | 64.4 |
| 90-94 | 47,690 | 18,340 | 29,350 | 0.2 | 0.2 | 0.3 | 62.5 |
| 95-99 | 13,052 | 5,161 | 7,891 | 0.1 | 0.1 | 0.1 | 65.4 |
| 100+ | 2,048 | 969 | 1,079 | 0 | 0 | 0 | 89.8 |
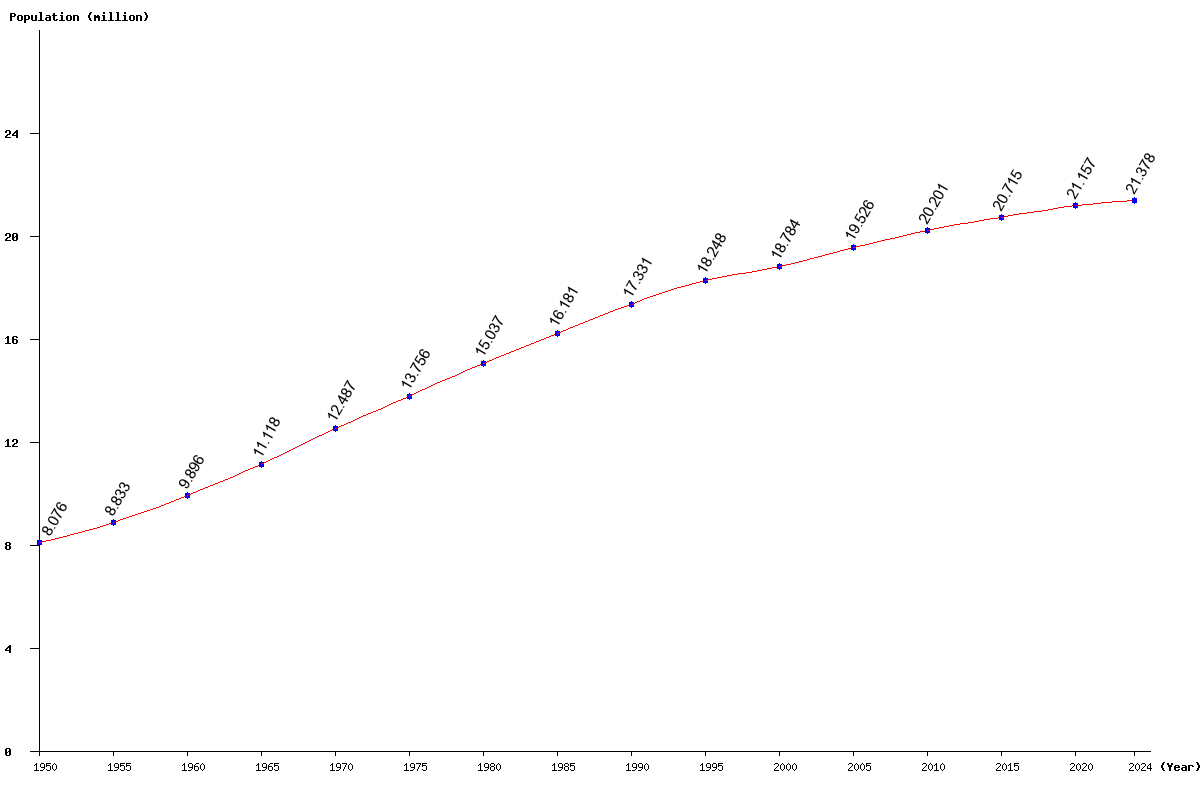
| Year | Population | Yearly % Change |
Yearly Change |
Sex ratio | Density (P/Km²) |
|---|---|---|---|---|---|
| 2025 | 21,417,175 | 0.18 | 39,007 | 91.51 | 341.53 |
| 2024 | 21,378,168 | 0.21 | 44,408 | 91.65 | 340.91 |
| 2023 | 21,333,760 | 0.24 | 50,815 | 91.80 | 340.20 |
| 2022 | 21,282,945 | 0.28 | 58,521 | 91.95 | 339.39 |
| 2021 | 21,224,424 | 0.32 | 67,005 | 92.09 | 338.45 |
| 2020 | 21,157,419 | 0.36 | 76,190 | 92.22 | 337.39 |
| 2019 | 21,081,229 | 0.40 | 84,751 | 92.34 | 336.17 |
| 2018 | 20,996,478 | 0.44 | 91,143 | 92.46 | 334.82 |
| 2017 | 20,905,335 | 0.45 | 94,519 | 92.58 | 333.37 |
| 2016 | 20,810,816 | 0.46 | 95,806 | 92.74 | 331.86 |
| 2015 | 20,715,010 | 0.47 | 96,019 | 92.95 | 330.33 |
| 2014 | 20,618,991 | 0.47 | 97,032 | 93.23 | 328.80 |
| 2013 | 20,521,959 | 0.49 | 100,097 | 93.56 | 327.25 |
| 2012 | 20,421,862 | 0.52 | 106,189 | 93.93 | 325.66 |
| 2011 | 20,315,673 | 0.57 | 114,361 | 94.35 | 323.96 |
| 2010 | 20,201,312 | 0.61 | 122,439 | 94.78 | 322.14 |
| 2005 | 19,526,406 | 3.95 | 742,661 | 97.23 | 311.38 |
| 2000 | 18,783,745 | 2.93 | 535,310 | 99.51 | 299.53 |
| 1995 | 18,248,435 | 5.29 | 917,618 | 100.91 | 291.00 |
| 1990 | 17,330,817 | 7.11 | 1,150,041 | 101.98 | 276.36 |
| 1985 | 16,180,776 | 7.61 | 1,144,214 | 103.19 | 258.03 |
| 1980 | 15,036,562 | 9.31 | 1,280,572 | 104.03 | 239.78 |
| 1975 | 13,755,990 | 10.16 | 1,268,497 | 104.82 | 219.36 |
| 1970 | 12,487,493 | 12.32 | 1,369,808 | 106.16 | 199.13 |
| 1965 | 11,117,685 | 12.34 | 1,221,513 | 107.83 | 177.29 |
| 1960 | 9,896,172 | 12.04 | 1,063,631 | 110.55 | 157.81 |
| 1955 | 8,832,541 | 9.37 | 756,731 | 114.51 | 140.85 |
| 1950 | 8,075,810 | 120.26 | 128.78 |