Southeast Asia population
0
Births this year: 0
Births today 0
Deaths this year 0
Deaths today 0
0
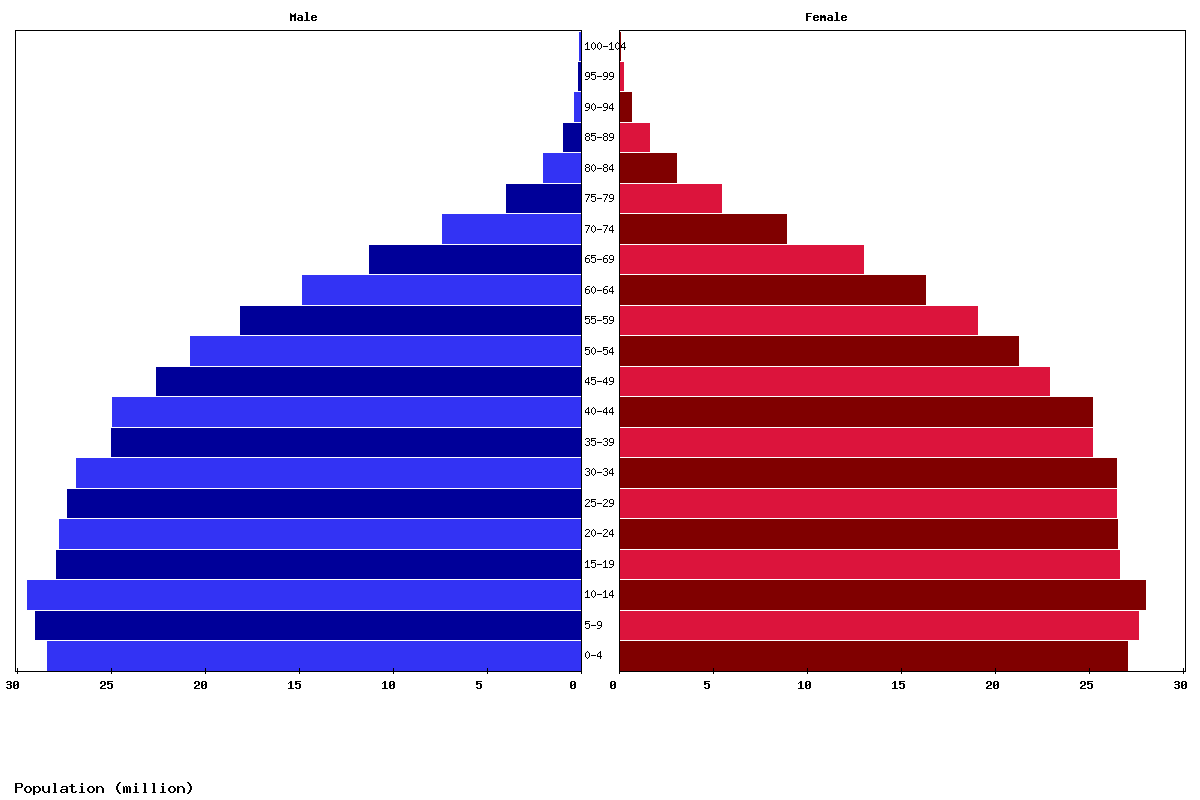
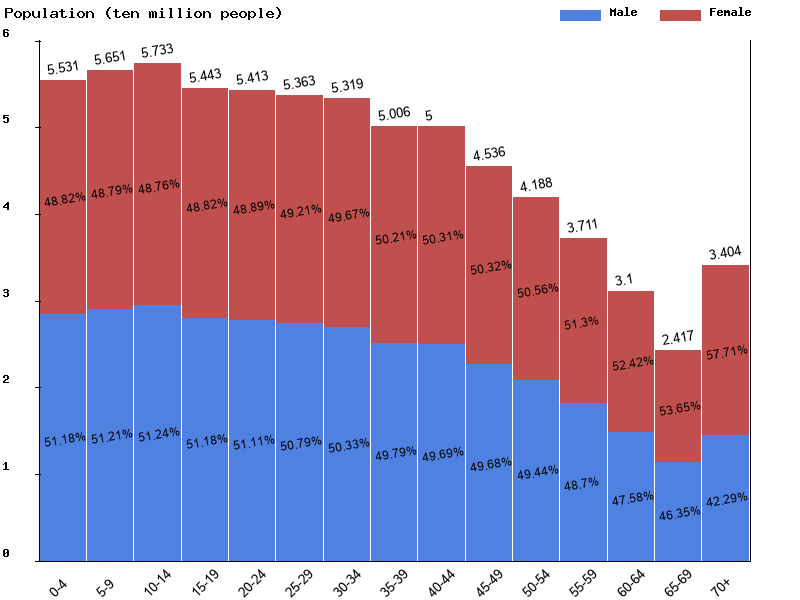
| Age | Both Sexes Population | Male Population | Female Population | Both Sexes (%) | Male (%) | Female (%) | Sex ratio (female/male) |
|---|---|---|---|---|---|---|---|
| Total | 698,153,592 | 347,592,316 | 350,561,276 | 100 | 100 | 100 | 99.2 |
| 00-04 | 55,308,117 | 28,306,448 | 27,001,669 | 7.9 | 8.1 | 7.7 | 104.8 |
| 05-09 | 56,510,232 | 28,938,081 | 27,572,151 | 8.1 | 8.3 | 7.9 | 105 |
| 10-14 | 57,329,374 | 29,378,437 | 27,950,937 | 8.2 | 8.5 | 8 | 105.1 |
| 15-19 | 54,429,897 | 27,859,923 | 26,569,974 | 7.8 | 8 | 7.6 | 104.9 |
| 20-24 | 54,131,925 | 27,668,457 | 26,463,468 | 7.8 | 8 | 7.5 | 104.6 |
| 25-29 | 53,632,537 | 27,239,639 | 26,392,898 | 7.7 | 7.8 | 7.5 | 103.2 |
| 30-34 | 53,193,774 | 26,771,318 | 26,422,456 | 7.6 | 7.7 | 7.5 | 101.3 |
| 35-39 | 50,061,389 | 24,924,431 | 25,136,958 | 7.2 | 7.2 | 7.2 | 99.2 |
| 40-44 | 49,998,310 | 24,844,736 | 25,153,574 | 7.2 | 7.1 | 7.2 | 98.8 |
| 45-49 | 45,364,449 | 22,535,316 | 22,829,133 | 6.5 | 6.5 | 6.5 | 98.7 |
| 50-54 | 41,883,804 | 20,708,654 | 21,175,150 | 6 | 6 | 6 | 97.8 |
| 55-59 | 37,105,520 | 18,071,596 | 19,033,924 | 5.3 | 5.2 | 5.4 | 94.9 |
| 60-64 | 31,001,202 | 14,748,994 | 16,252,208 | 4.4 | 4.2 | 4.6 | 90.8 |
| 65-69 | 24,166,980 | 11,202,153 | 12,964,827 | 3.5 | 3.2 | 3.7 | 86.4 |
| 70-74 | 16,188,739 | 7,323,297 | 8,865,442 | 2.3 | 2.1 | 2.5 | 82.6 |
| 75-79 | 9,264,145 | 3,884,112 | 5,380,033 | 1.3 | 1.1 | 1.5 | 72.2 |
| 80-84 | 4,932,478 | 1,940,049 | 2,992,429 | 0.7 | 0.6 | 0.9 | 64.8 |
| 85-89 | 2,434,400 | 872,223 | 1,562,177 | 0.3 | 0.3 | 0.4 | 55.8 |
| 90-94 | 911,382 | 292,325 | 619,057 | 0.1 | 0.1 | 0.2 | 47.2 |
| 95-99 | 249,270 | 69,733 | 179,537 | 0 | 0 | 0.1 | 38.8 |
| 100+ | 55,668 | 12,394 | 43,274 | 0 | 0 | 0 | 28.6 |
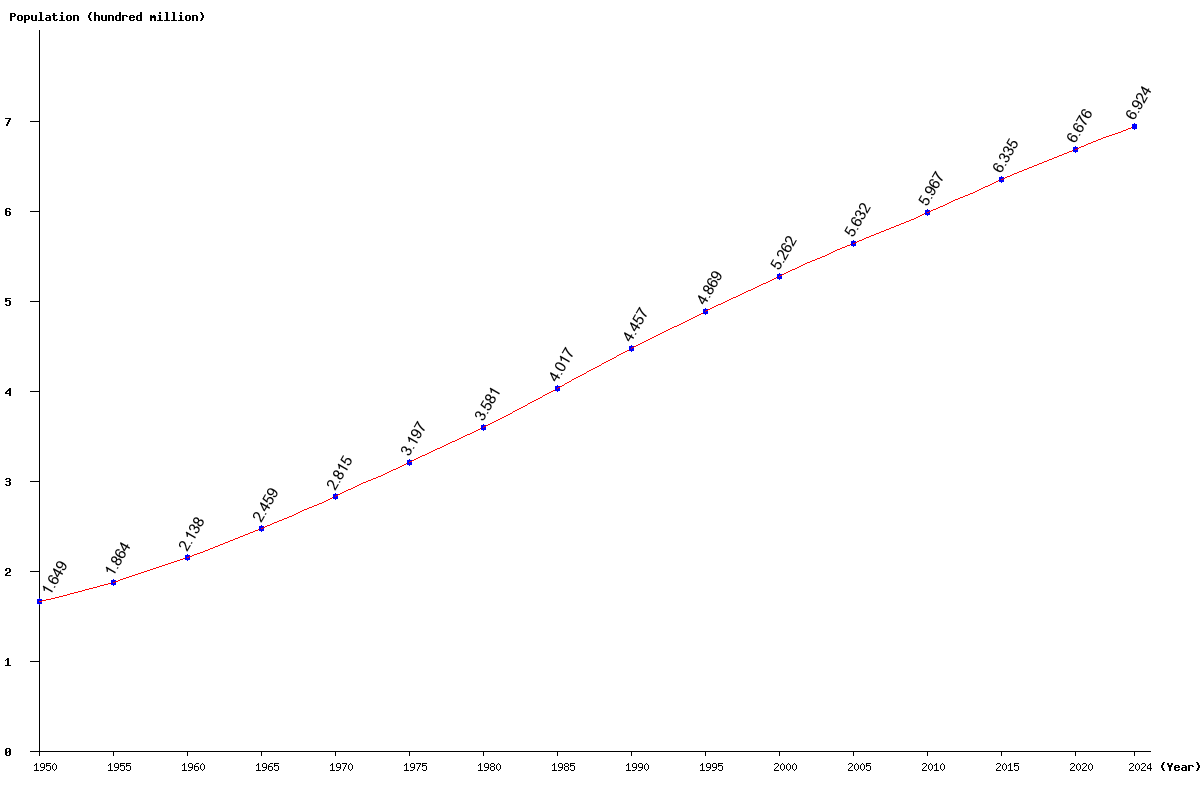
| Year | Population | Yearly % Change |
Yearly Change |
Sex ratio | Density (P/Km²) |
|---|---|---|---|---|---|
| 2025 | 698,153,592 | 0.84 | 5,801,008 | 99.15 | 160.84 |
| 2024 | 692,352,584 | 0.87 | 5,952,421 | 99.21 | 159.50 |
| 2023 | 686,400,163 | 0.90 | 6,104,600 | 99.27 | 158.13 |
| 2022 | 680,295,563 | 0.93 | 6,258,011 | 99.33 | 156.72 |
| 2021 | 674,037,552 | 0.96 | 6,410,611 | 99.38 | 155.28 |
| 2020 | 667,626,941 | 0.99 | 6,547,506 | 99.43 | 153.81 |
| 2019 | 661,079,435 | 1.02 | 6,675,197 | 99.47 | 152.30 |
| 2018 | 654,404,238 | 1.05 | 6,814,285 | 99.51 | 150.76 |
| 2017 | 647,589,953 | 1.09 | 6,970,650 | 99.55 | 149.19 |
| 2016 | 640,619,303 | 1.13 | 7,129,357 | 99.59 | 147.58 |
| 2015 | 633,489,946 | 1.17 | 7,309,229 | 99.62 | 145.94 |
| 2014 | 626,180,717 | 1.21 | 7,457,018 | 99.67 | 144.26 |
| 2013 | 618,723,699 | 1.23 | 7,490,649 | 99.71 | 142.54 |
| 2012 | 611,233,050 | 1.22 | 7,372,602 | 99.74 | 140.81 |
| 2011 | 603,860,448 | 1.20 | 7,152,593 | 99.76 | 139.12 |
| 2010 | 596,707,855 | 1.17 | 6,881,347 | 99.73 | 137.47 |
| 2005 | 563,156,681 | 7.03 | 36,977,873 | 99.26 | 129.74 |
| 2000 | 526,178,808 | 8.07 | 39,297,564 | 99.20 | 121.22 |
| 1995 | 486,881,244 | 9.25 | 41,215,984 | 99.37 | 112.17 |
| 1990 | 445,665,260 | 10.94 | 43,953,504 | 99.56 | 102.67 |
| 1985 | 401,711,756 | 12.18 | 43,606,045 | 99.23 | 92.55 |
| 1980 | 358,105,711 | 12.01 | 38,385,018 | 99.19 | 82.50 |
| 1975 | 319,720,693 | 13.57 | 38,199,550 | 99.28 | 73.66 |
| 1970 | 281,521,143 | 14.50 | 35,644,690 | 99.29 | 64.86 |
| 1965 | 245,876,453 | 14.98 | 32,038,336 | 99.21 | 56.64 |
| 1960 | 213,838,117 | 14.70 | 27,408,084 | 99.05 | 49.26 |
| 1955 | 186,430,033 | 13.06 | 21,529,689 | 98.92 | 42.95 |
| 1950 | 164,900,344 | 99.01 | 37.99 |