South Korea population
52,199,580
Births this year: 4,120,548
Births today 1,131
Deaths this year 2,845,140
Deaths today 781
52,199,580
| Region Name | Percents | Number |
|---|---|---|
| Christian (Protestant, Roman Catholic) | 31.6% | 16,092,038 people |
| Buddhist | 24.2% | 12,323,650 people |
| other or unknown | 0.9% | 458,318 people |
| none | 43.3% | 22,050,166 people |
| Ethnic groups Name | Percents | Number |
|---|---|---|
| homogeneous | 100% | 50,924,172 people |
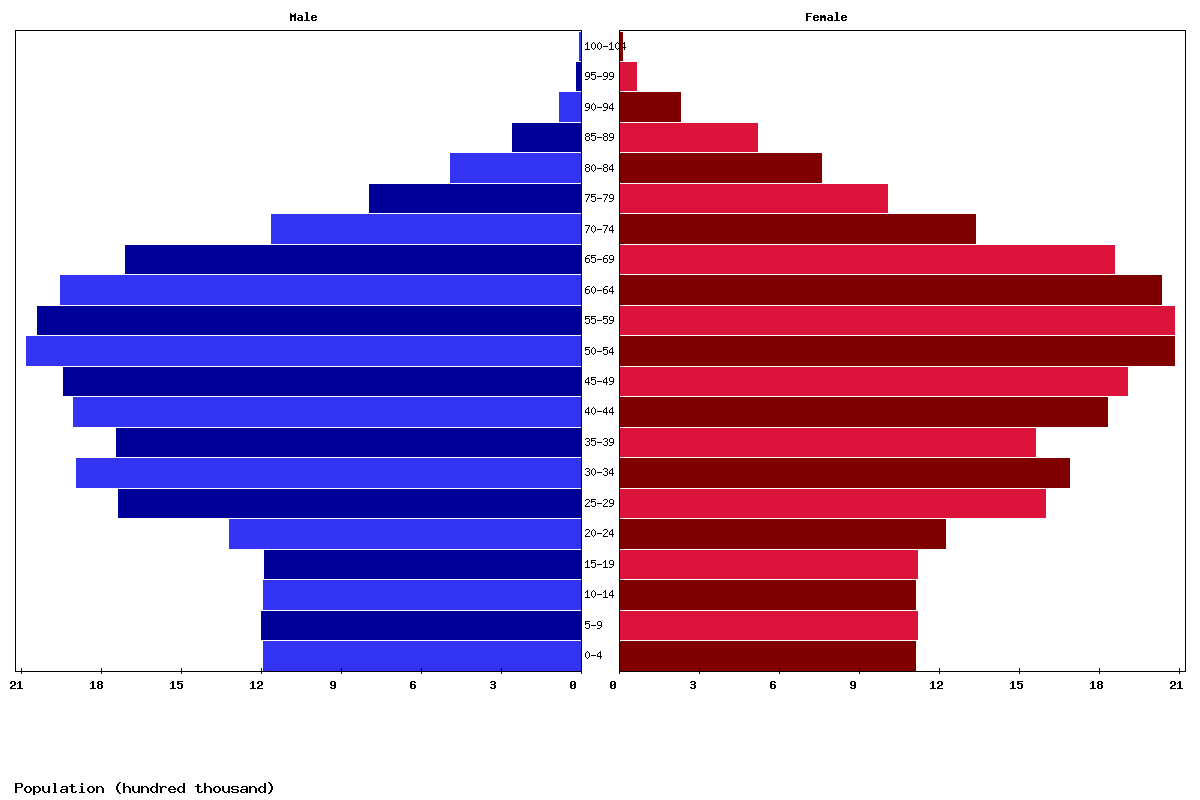
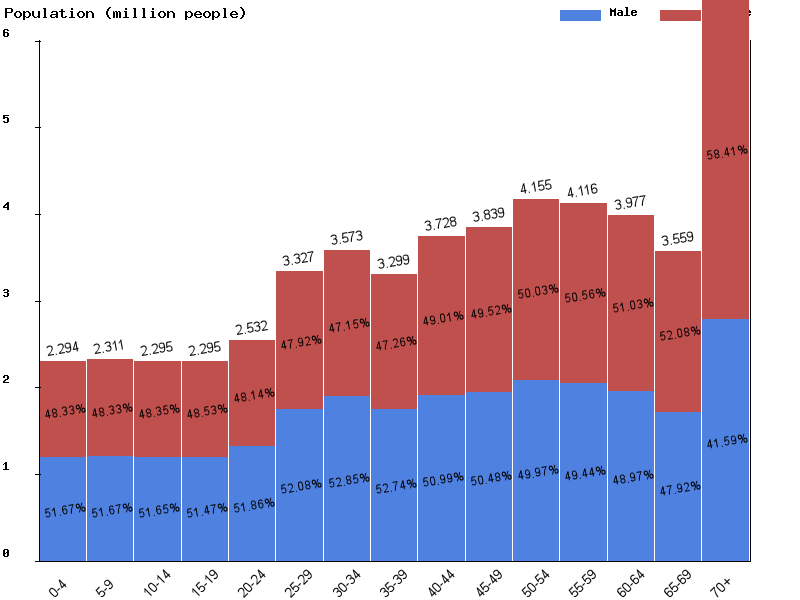
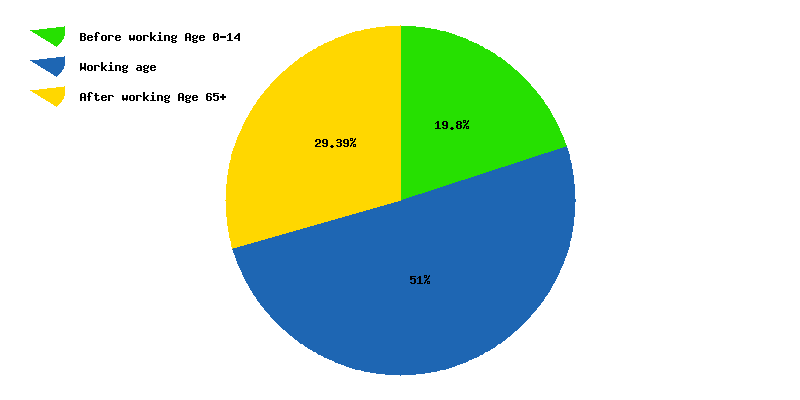
| Age | Both Sexes Population | Male Population | Female Population | Both Sexes (%) | Male (%) | Female (%) | Sex ratio (female/male) |
|---|---|---|---|---|---|---|---|
| Total | 51,982,344 | 25,802,508 | 26,179,836 | 100 | 100 | 100 | 98.6 |
| 00-04 | 2,294,048 | 1,185,353 | 1,108,695 | 4.4 | 4.6 | 4.2 | 106.9 |
| 05-09 | 2,311,061 | 1,194,010 | 1,117,051 | 4.4 | 4.6 | 4.3 | 106.9 |
| 10-14 | 2,294,810 | 1,185,275 | 1,109,535 | 4.4 | 4.6 | 4.2 | 106.8 |
| 15-19 | 2,295,413 | 1,181,478 | 1,113,935 | 4.4 | 4.6 | 4.3 | 106.1 |
| 20-24 | 2,532,000 | 1,313,078 | 1,218,922 | 4.9 | 5.1 | 4.7 | 107.7 |
| 25-29 | 3,326,609 | 1,732,405 | 1,594,204 | 6.4 | 6.7 | 6.1 | 108.7 |
| 30-34 | 3,573,083 | 1,888,422 | 1,684,661 | 6.9 | 7.3 | 6.4 | 112.1 |
| 35-39 | 3,298,642 | 1,739,711 | 1,558,931 | 6.3 | 6.7 | 6 | 111.6 |
| 40-44 | 3,728,116 | 1,901,048 | 1,827,068 | 7.2 | 7.4 | 7 | 104 |
| 45-49 | 3,839,408 | 1,938,010 | 1,901,398 | 7.4 | 7.5 | 7.3 | 101.9 |
| 50-54 | 4,155,406 | 2,076,575 | 2,078,831 | 8 | 8 | 7.9 | 99.9 |
| 55-59 | 4,115,932 | 2,035,031 | 2,080,901 | 7.9 | 7.9 | 7.9 | 97.8 |
| 60-64 | 3,976,629 | 1,947,359 | 2,029,270 | 7.6 | 7.5 | 7.8 | 96 |
| 65-69 | 3,559,453 | 1,705,749 | 1,853,704 | 6.8 | 6.6 | 7.1 | 92 |
| 70-74 | 2,489,854 | 1,157,622 | 1,332,232 | 4.8 | 4.5 | 5.1 | 86.9 |
| 75-79 | 1,791,735 | 789,686 | 1,002,049 | 3.4 | 3.1 | 3.8 | 78.8 |
| 80-84 | 1,243,678 | 486,729 | 756,949 | 2.4 | 1.9 | 2.9 | 64.3 |
| 85-89 | 768,230 | 253,478 | 514,752 | 1.5 | 1 | 2 | 49.2 |
| 90-94 | 304,922 | 76,944 | 227,978 | 0.6 | 0.3 | 0.9 | 33.8 |
| 95-99 | 73,262 | 13,075 | 60,187 | 0.1 | 0.1 | 0.2 | 21.7 |
| 100+ | 10,053 | 1,470 | 8,583 | 0 | 0 | 0 | 17.1 |


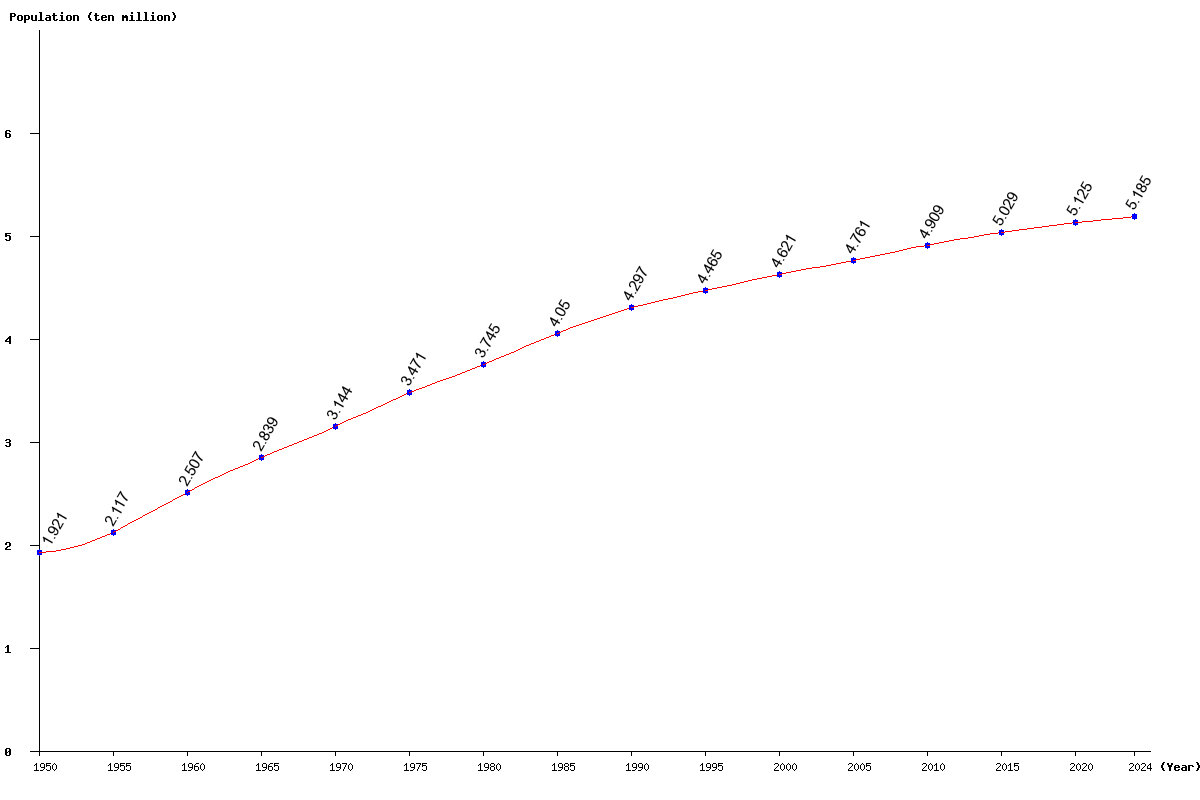
| Year | Population | Yearly % Change |
Yearly Change |
Sex ratio | Density (P/Km²) |
|---|---|---|---|---|---|
| 2025 | 51,982,344 | 0.25 | 131,604 | 98.56 | 534.63 |
| 2024 | 51,850,740 | 0.27 | 137,875 | 98.59 | 533.28 |
| 2023 | 51,712,865 | 0.28 | 144,949 | 98.62 | 531.86 |
| 2022 | 51,567,916 | 0.30 | 153,438 | 98.65 | 530.37 |
| 2021 | 51,414,478 | 0.32 | 162,992 | 98.68 | 528.79 |
| 2020 | 51,251,486 | 0.34 | 172,731 | 98.70 | 527.12 |
| 2019 | 51,078,755 | 0.36 | 182,161 | 98.72 | 525.34 |
| 2018 | 50,896,594 | 0.38 | 191,623 | 98.74 | 523.47 |
| 2017 | 50,704,971 | 0.40 | 201,038 | 98.76 | 521.50 |
| 2016 | 50,503,933 | 0.42 | 210,494 | 98.78 | 519.43 |
| 2015 | 50,293,439 | 0.44 | 219,038 | 98.80 | 517.26 |
| 2014 | 50,074,401 | 0.46 | 227,645 | 98.82 | 515.01 |
| 2013 | 49,846,756 | 0.48 | 238,305 | 98.83 | 512.67 |
| 2012 | 49,608,451 | 0.51 | 251,759 | 98.86 | 510.22 |
| 2011 | 49,356,692 | 0.54 | 266,651 | 98.91 | 507.63 |
| 2010 | 49,090,041 | 0.58 | 283,005 | 99.00 | 504.89 |
| 2005 | 47,605,863 | 3.03 | 1,399,592 | 99.89 | 489.62 |
| 2000 | 46,206,271 | 3.48 | 1,553,277 | 100.66 | 475.23 |
| 1995 | 44,652,994 | 3.91 | 1,680,740 | 100.31 | 459.25 |
| 1990 | 42,972,254 | 6.10 | 2,470,337 | 100.34 | 441.96 |
| 1985 | 40,501,917 | 8.15 | 3,050,832 | 99.97 | 416.56 |
| 1980 | 37,451,085 | 7.89 | 2,738,007 | 100.26 | 385.18 |
| 1975 | 34,713,078 | 10.42 | 3,275,937 | 100.96 | 357.02 |
| 1970 | 31,437,141 | 10.72 | 3,044,419 | 100.47 | 323.33 |
| 1965 | 28,392,722 | 13.24 | 3,318,694 | 100.97 | 292.02 |
| 1960 | 25,074,028 | 18.45 | 3,905,417 | 100.45 | 257.88 |
| 1955 | 21,168,611 | 10.19 | 1,957,225 | 99.51 | 217.72 |
| 1950 | 19,211,386 | 99.22 | 197.59 |
