South Europe population
0
Births this year: 0
Births today 0
Deaths this year 0
Deaths today 0
0
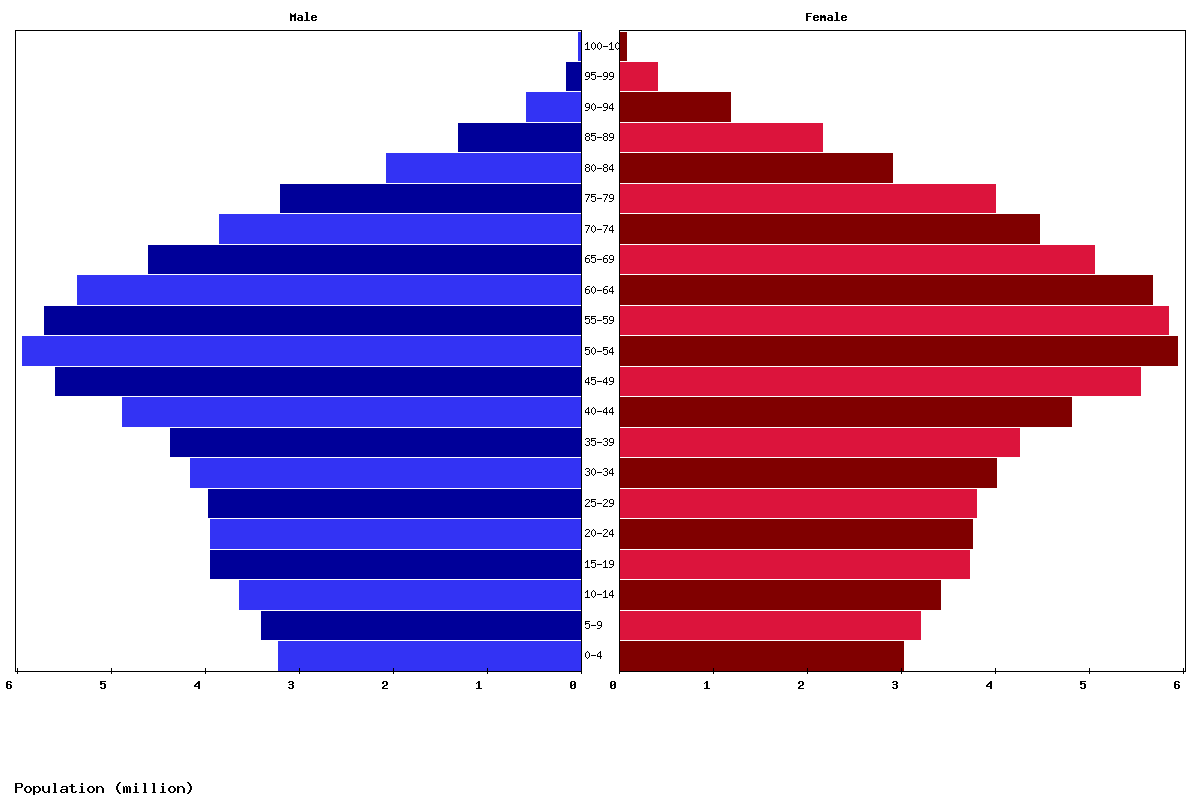
| Age | Both Sexes Population | Male Population | Female Population | Both Sexes (%) | Male (%) | Female (%) | Sex ratio (female/male) |
|---|---|---|---|---|---|---|---|
| Total | 150,771,363 | 73,643,956 | 77,127,407 | 100 | 100 | 100 | 95.5 |
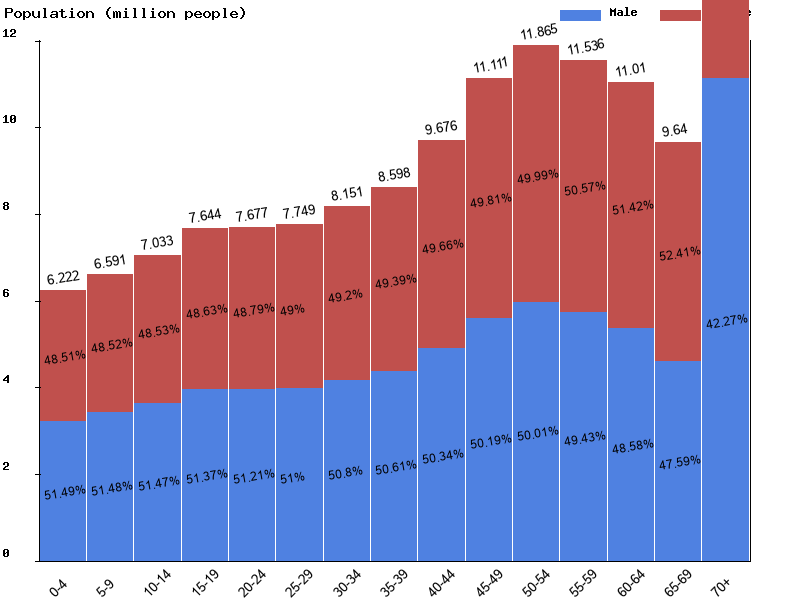
| 00-04 | 6,222,239 | 3,203,569 | 3,018,670 | 4.1 | 4.4 | 3.9 | 106.1 |
| 05-09 | 6,590,812 | 3,393,237 | 3,197,575 | 4.4 | 4.6 | 4.1 | 106.1 |
| 10-14 | 7,033,370 | 3,620,309 | 3,413,061 | 4.7 | 4.9 | 4.4 | 106.1 |
| 15-19 | 7,644,402 | 3,926,606 | 3,717,796 | 5.1 | 5.3 | 4.8 | 105.6 |
| 20-24 | 7,677,063 | 3,931,555 | 3,745,508 | 5.1 | 5.3 | 4.9 | 105 |
| 25-29 | 7,749,397 | 3,951,910 | 3,797,487 | 5.1 | 5.4 | 4.9 | 104.1 |
| 30-34 | 8,150,695 | 4,140,887 | 4,009,808 | 5.4 | 5.6 | 5.2 | 103.3 |
| 35-39 | 8,598,045 | 4,351,727 | 4,246,318 | 5.7 | 5.9 | 5.5 | 102.5 |
| 40-44 | 9,675,614 | 4,871,139 | 4,804,475 | 6.4 | 6.6 | 6.2 | 101.4 |
| 45-49 | 11,111,491 | 5,577,214 | 5,534,277 | 7.4 | 7.6 | 7.2 | 100.8 |
| 50-54 | 11,864,824 | 5,933,237 | 5,931,587 | 7.9 | 8.1 | 7.7 | 100 |
| 55-59 | 11,535,996 | 5,701,848 | 5,834,148 | 7.7 | 7.7 | 7.6 | 97.7 |
| 60-64 | 11,010,369 | 5,348,763 | 5,661,606 | 7.3 | 7.3 | 7.3 | 94.5 |
| 65-69 | 9,640,312 | 4,587,720 | 5,052,592 | 6.4 | 6.2 | 6.6 | 90.8 |
| 70-74 | 8,292,189 | 3,831,349 | 4,460,840 | 5.5 | 5.2 | 5.8 | 85.9 |
| 75-79 | 7,184,958 | 3,185,144 | 3,999,814 | 4.8 | 4.3 | 5.2 | 79.6 |
| 80-84 | 4,961,092 | 2,061,093 | 2,899,999 | 3.3 | 2.8 | 3.8 | 71.1 |
| 85-89 | 3,451,267 | 1,293,063 | 2,158,204 | 2.3 | 1.8 | 2.8 | 59.9 |
| 90-94 | 1,744,123 | 568,185 | 1,175,938 | 1.2 | 0.8 | 1.5 | 48.3 |
| 95-99 | 540,570 | 145,226 | 395,344 | 0.4 | 0.2 | 0.5 | 36.7 |
| 100+ | 92,535 | 20,175 | 72,360 | 0.1 | 0 | 0.1 | 27.9 |
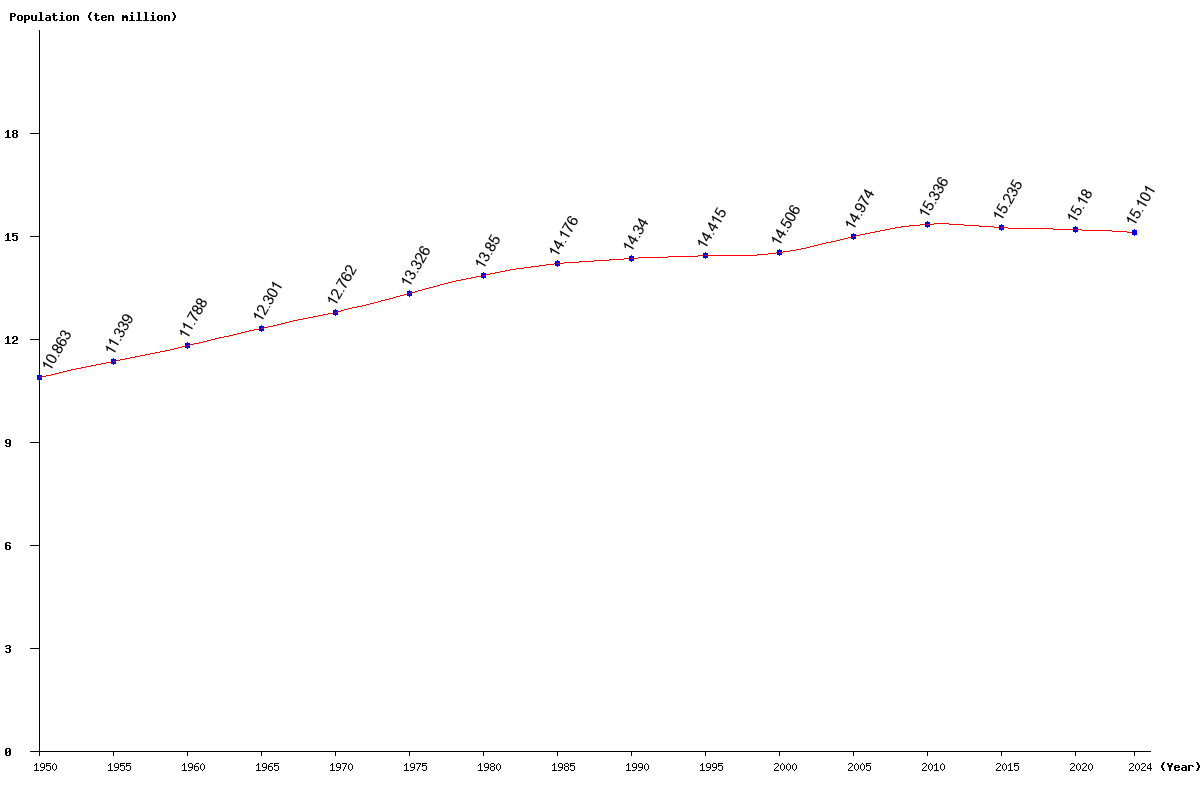
| Year | Population | Yearly % Change |
Yearly Change |
Sex ratio | Density (P/Km²) |
|---|---|---|---|---|---|
| 2025 | 150,771,363 | -0.16 | -237,696 | 95.48 | 116.43 |
| 2024 | 151,009,059 | -0.15 | -228,238 | 95.45 | 116.62 |
| 2023 | 151,237,297 | -0.14 | -212,467 | 95.42 | 116.79 |
| 2022 | 151,449,764 | -0.12 | -188,480 | 95.39 | 116.96 |
| 2021 | 151,638,244 | -0.11 | -159,989 | 95.35 | 117.10 |
| 2020 | 151,798,233 | -0.08 | -114,927 | 95.31 | 117.23 |
| 2019 | 151,913,160 | -0.05 | -72,492 | 95.25 | 117.31 |
| 2018 | 151,985,652 | -0.04 | -66,578 | 95.19 | 117.37 |
| 2017 | 152,052,230 | -0.07 | -111,190 | 95.14 | 117.42 |
| 2016 | 152,163,420 | -0.12 | -184,472 | 95.12 | 117.51 |
| 2015 | 152,347,892 | -0.18 | -281,394 | 95.15 | 117.65 |
| 2014 | 152,629,286 | -0.23 | -346,336 | 95.24 | 117.87 |
| 2013 | 152,975,622 | -0.21 | -316,834 | 95.38 | 118.14 |
| 2012 | 153,292,456 | -0.10 | -158,206 | 95.54 | 118.38 |
| 2011 | 153,450,662 | 0.06 | 90,626 | 95.70 | 118.50 |
| 2010 | 153,360,036 | 0.24 | 363,748 | 95.81 | 118.43 |
| 2005 | 149,735,395 | 3.22 | 4,677,325 | 95.90 | 115.63 |
| 2000 | 145,058,070 | 0.63 | 911,522 | 95.52 | 112.02 |
| 1995 | 144,146,548 | 0.52 | 742,755 | 95.40 | 111.32 |
| 1990 | 143,403,793 | 1.16 | 1,642,196 | 95.77 | 110.74 |
| 1985 | 141,761,597 | 2.36 | 3,266,579 | 95.88 | 109.48 |
| 1980 | 138,495,018 | 3.93 | 5,236,494 | 95.72 | 106.95 |
| 1975 | 133,258,524 | 4.42 | 5,641,197 | 95.64 | 102.91 |
| 1970 | 127,617,327 | 3.74 | 4,602,359 | 95.32 | 98.55 |
| 1965 | 123,014,968 | 4.36 | 5,135,635 | 95.02 | 95.00 |
| 1960 | 117,879,333 | 3.96 | 4,491,817 | 94.77 | 91.03 |
| 1955 | 113,387,516 | 4.38 | 4,754,537 | 94.39 | 87.56 |
| 1950 | 108,632,979 | 94.07 | 83.89 |