South Asia population
0
Births this year: 0
Births today 0
Deaths this year 0
Deaths today 0
0
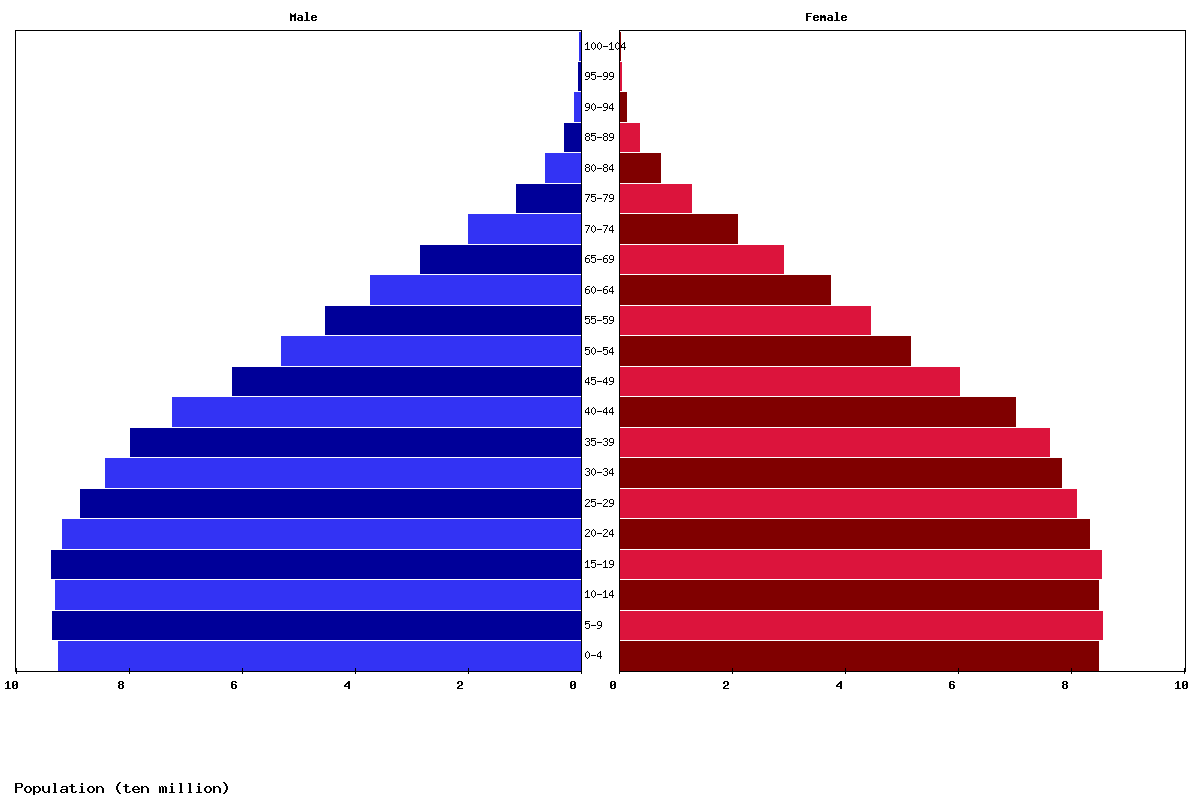
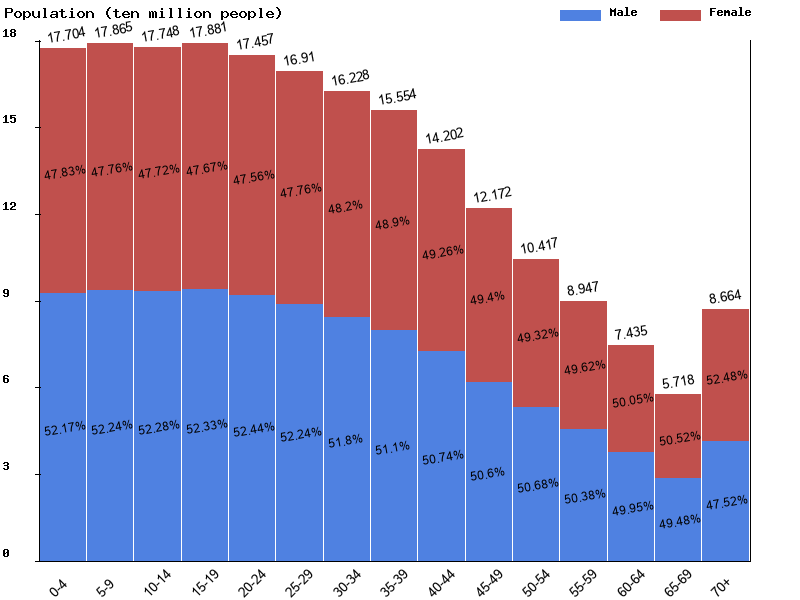
| Age | Both Sexes Population | Male Population | Female Population | Both Sexes (%) | Male (%) | Female (%) | Sex ratio (female/male) |
|---|---|---|---|---|---|---|---|
| Total | 2,049,007,940 | 1,053,568,899 | 995,439,041 | 100 | 100 | 100 | 105.8 |
| 00-04 | 177,044,057 | 92,363,828 | 84,680,229 | 8.6 | 8.8 | 8.5 | 109.1 |
| 05-09 | 178,647,817 | 93,331,664 | 85,316,153 | 8.7 | 8.9 | 8.6 | 109.4 |
| 10-14 | 177,475,828 | 92,783,445 | 84,692,383 | 8.7 | 8.8 | 8.5 | 109.6 |
| 15-19 | 178,806,978 | 93,573,353 | 85,233,625 | 8.7 | 8.9 | 8.6 | 109.8 |
| 20-24 | 174,569,536 | 91,542,089 | 83,027,447 | 8.5 | 8.7 | 8.3 | 110.3 |
| 25-29 | 169,095,021 | 88,328,648 | 80,766,373 | 8.3 | 8.4 | 8.1 | 109.4 |
| 30-34 | 162,276,045 | 84,052,769 | 78,223,276 | 7.9 | 8 | 7.9 | 107.5 |
| 35-39 | 155,540,521 | 79,481,857 | 76,058,664 | 7.6 | 7.5 | 7.6 | 104.5 |
| 40-44 | 142,018,729 | 72,060,334 | 69,958,395 | 6.9 | 6.8 | 7 | 103 |
| 45-49 | 121,721,014 | 61,590,308 | 60,130,706 | 5.9 | 5.8 | 6 | 102.4 |
| 50-54 | 104,171,342 | 52,789,329 | 51,382,013 | 5.1 | 5 | 5.2 | 102.7 |
| 55-59 | 89,471,381 | 45,072,294 | 44,399,087 | 4.4 | 4.3 | 4.5 | 101.5 |
| 60-64 | 74,345,879 | 37,133,123 | 37,212,756 | 3.6 | 3.5 | 3.7 | 99.8 |
| 65-69 | 57,179,331 | 28,291,868 | 28,887,463 | 2.8 | 2.7 | 2.9 | 97.9 |
| 70-74 | 40,446,988 | 19,724,985 | 20,722,003 | 2 | 1.9 | 2.1 | 95.2 |
| 75-79 | 23,901,928 | 11,268,570 | 12,633,358 | 1.2 | 1.1 | 1.3 | 89.2 |
| 80-84 | 13,285,126 | 6,136,386 | 7,148,740 | 0.6 | 0.6 | 0.7 | 85.8 |
| 85-89 | 6,249,387 | 2,812,636 | 3,436,751 | 0.3 | 0.3 | 0.3 | 81.8 |
| 90-94 | 2,160,032 | 962,599 | 1,197,433 | 0.1 | 0.1 | 0.1 | 80.4 |
| 95-99 | 514,042 | 230,032 | 284,010 | 0 | 0 | 0 | 81 |
| 100+ | 86,958 | 38,782 | 48,176 | 0 | 0 | 0 | 80.5 |
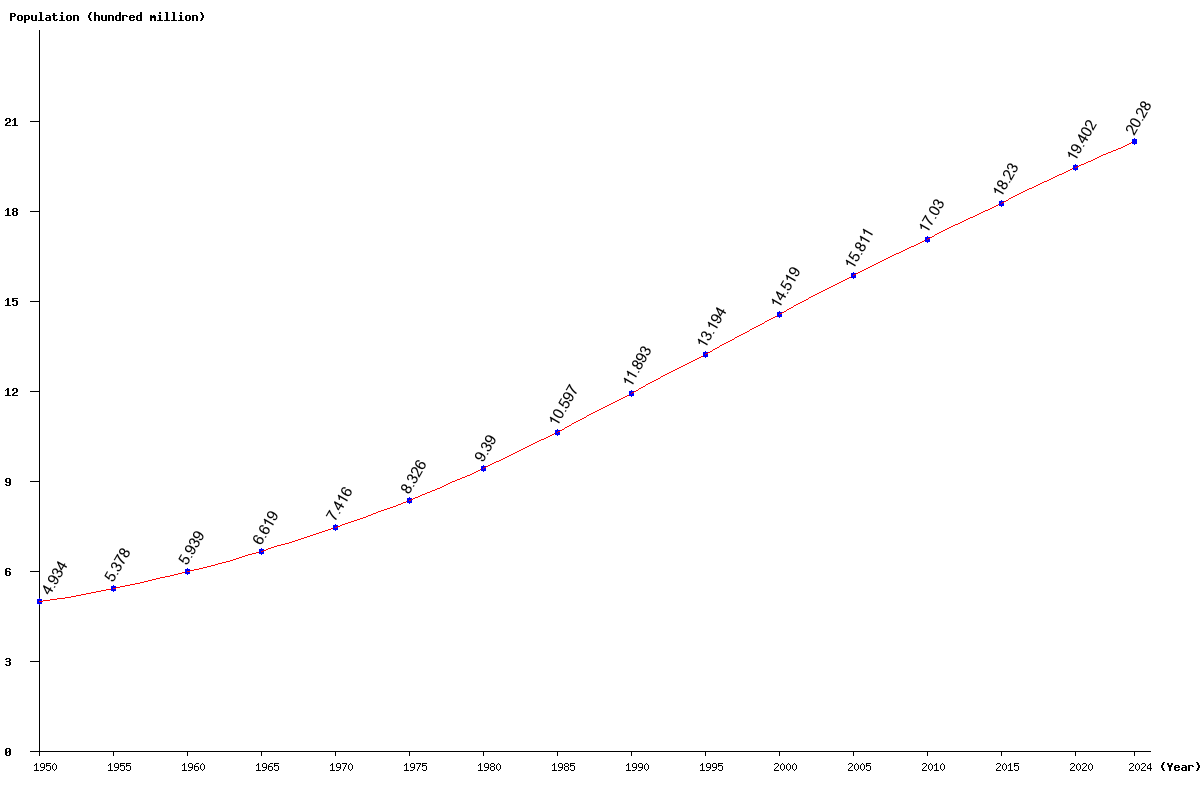
| Year | Population | Yearly % Change |
Yearly Change |
Sex ratio | Density (P/Km²) |
|---|---|---|---|---|---|
| 2025 | 2,049,007,940 | 1.03 | 20,975,211 | 105.84 | 320.15 |
| 2024 | 2,028,032,729 | 1.07 | 21,378,675 | 105.89 | 316.87 |
| 2023 | 2,006,654,054 | 1.10 | 21,776,121 | 105.93 | 313.53 |
| 2022 | 1,984,877,933 | 1.13 | 22,169,039 | 105.97 | 310.13 |
| 2021 | 1,962,708,894 | 1.16 | 22,548,410 | 106.01 | 306.67 |
| 2020 | 1,940,160,484 | 1.20 | 22,920,203 | 106.05 | 303.14 |
| 2019 | 1,917,240,281 | 1.23 | 23,257,702 | 106.08 | 299.56 |
| 2018 | 1,893,982,579 | 1.26 | 23,521,776 | 106.11 | 295.93 |
| 2017 | 1,870,460,803 | 1.28 | 23,693,322 | 106.14 | 292.25 |
| 2016 | 1,846,767,481 | 1.31 | 23,793,407 | 106.17 | 288.55 |
| 2015 | 1,822,974,074 | 1.33 | 23,873,444 | 106.20 | 284.83 |
| 2014 | 1,799,100,630 | 1.35 | 23,954,083 | 106.23 | 281.10 |
| 2013 | 1,775,146,547 | 1.37 | 24,012,586 | 106.26 | 277.36 |
| 2012 | 1,751,133,961 | 1.39 | 24,053,427 | 106.29 | 273.61 |
| 2011 | 1,727,080,534 | 1.41 | 24,089,712 | 106.33 | 269.85 |
| 2010 | 1,702,990,822 | 1.44 | 24,097,466 | 106.38 | 266.09 |
| 2005 | 1,581,124,102 | 8.90 | 129,191,341 | 106.68 | 247.05 |
| 2000 | 1,451,932,761 | 10.05 | 132,536,801 | 106.60 | 226.86 |
| 1995 | 1,319,395,960 | 10.94 | 130,135,454 | 106.66 | 206.15 |
| 1990 | 1,189,260,506 | 12.22 | 129,520,169 | 106.65 | 185.82 |
| 1985 | 1,059,740,337 | 12.85 | 120,697,313 | 106.82 | 165.58 |
| 1980 | 939,043,024 | 12.78 | 106,432,168 | 107.04 | 146.72 |
| 1975 | 832,610,856 | 12.27 | 91,007,955 | 107.22 | 130.09 |
| 1970 | 741,602,901 | 12.05 | 79,730,319 | 107.26 | 115.87 |
| 1965 | 661,872,582 | 11.44 | 67,929,398 | 107.26 | 103.42 |
| 1960 | 593,943,184 | 10.44 | 56,147,215 | 107.17 | 92.80 |
| 1955 | 537,795,969 | 8.99 | 44,352,682 | 106.98 | 84.03 |
| 1950 | 493,443,287 | 106.86 | 77.10 |