Samoa population
22,924
Births this year: 4,082
Births today 0
Deaths this year 1,050
Deaths today 0
22,924
| Region Name | Percents | Number |
|---|---|---|
| Protestant (Congregationalist, Methodist, Assembly of God, Seventh-Day Adventist) | 57.4% | 11,418 people |
| Roman Catholic | 19.4% | 3,859 people |
| Mormon | 15.2% | 3,024 people |
| Worship Centre | 1.7% | 338 people |
| other Christian | 5.5% | 1,094 people |
| other | 0.7% | 139 people |
| none | 0.1% | 20 people |
| unspecified | 0.1% | 20 people |
| Ethnic groups Name | Percents | Number |
|---|---|---|
| Samoan | 92.6% | 18,420 people |
| Euronesians (persons of European and Polynesian blood) | 7% | 1,392 people |
| Europeans | 0.4% | 80 people |
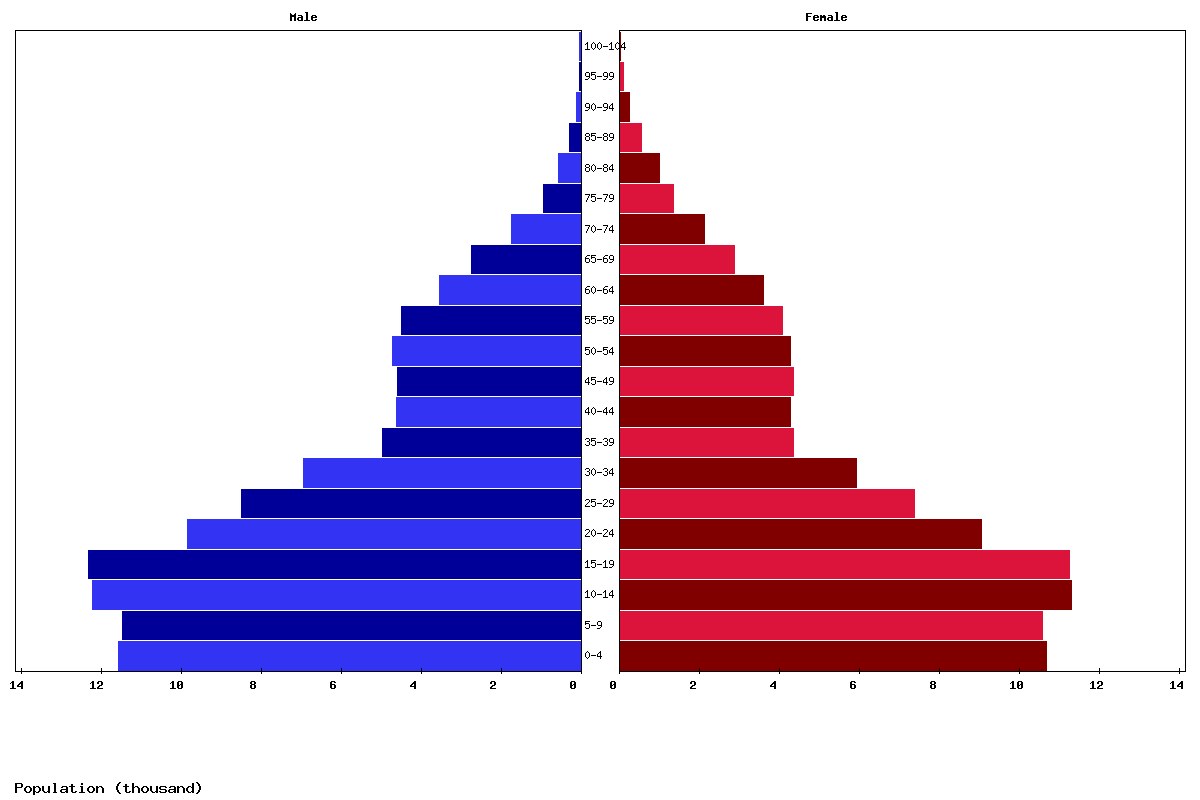
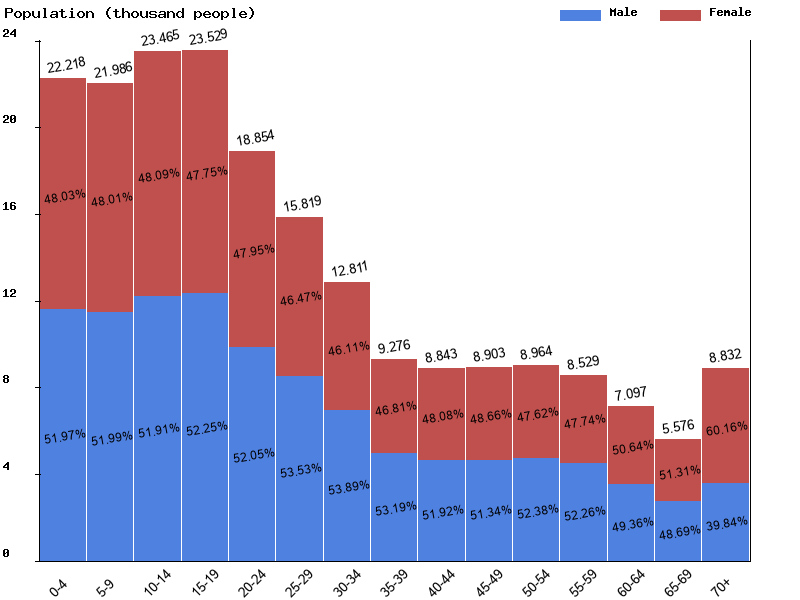
| Age | Both Sexes Population | Male Population | Female Population | Both Sexes (%) | Male (%) | Female (%) | Sex ratio (female/male) |
|---|---|---|---|---|---|---|---|
| Total | 204,702 | 105,623 | 99,079 | 100 | 100 | 100 | 106.6 |
| 00-04 | 22,218 | 11,546 | 10,672 | 10.9 | 10.9 | 10.8 | 108.2 |
| 05-09 | 21,986 | 11,431 | 10,555 | 10.7 | 10.8 | 10.7 | 108.3 |
| 10-14 | 23,465 | 12,181 | 11,284 | 11.5 | 11.5 | 11.4 | 107.9 |
| 15-19 | 23,529 | 12,294 | 11,235 | 11.5 | 11.6 | 11.3 | 109.4 |
| 20-24 | 18,854 | 9,814 | 9,040 | 9.2 | 9.3 | 9.1 | 108.6 |
| 25-29 | 15,819 | 8,468 | 7,351 | 7.7 | 8 | 7.4 | 115.2 |
| 30-34 | 12,811 | 6,904 | 5,907 | 6.3 | 6.5 | 6 | 116.9 |
| 35-39 | 9,276 | 4,934 | 4,342 | 4.5 | 4.7 | 4.4 | 113.6 |
| 40-44 | 8,843 | 4,591 | 4,252 | 4.3 | 4.3 | 4.3 | 108 |
| 45-49 | 8,903 | 4,571 | 4,332 | 4.3 | 4.3 | 4.4 | 105.5 |
| 50-54 | 8,964 | 4,695 | 4,269 | 4.4 | 4.4 | 4.3 | 110 |
| 55-59 | 8,529 | 4,457 | 4,072 | 4.2 | 4.2 | 4.1 | 109.5 |
| 60-64 | 7,097 | 3,503 | 3,594 | 3.5 | 3.3 | 3.6 | 97.5 |
| 65-69 | 5,576 | 2,715 | 2,861 | 2.7 | 2.6 | 2.9 | 94.9 |
| 70-74 | 3,825 | 1,706 | 2,119 | 1.9 | 1.6 | 2.1 | 80.5 |
| 75-79 | 2,258 | 917 | 1,341 | 1.1 | 0.9 | 1.4 | 68.4 |
| 80-84 | 1,545 | 548 | 997 | 0.8 | 0.5 | 1 | 55 |
| 85-89 | 791 | 255 | 536 | 0.4 | 0.2 | 0.5 | 47.6 |
| 90-94 | 308 | 76 | 232 | 0.2 | 0.1 | 0.2 | 32.8 |
| 95-99 | 92 | 15 | 77 | 0 | 0 | 0.1 | 19.5 |
| 100+ | 13 | 2 | 11 | 0 | 0 | 0 | 18.2 |
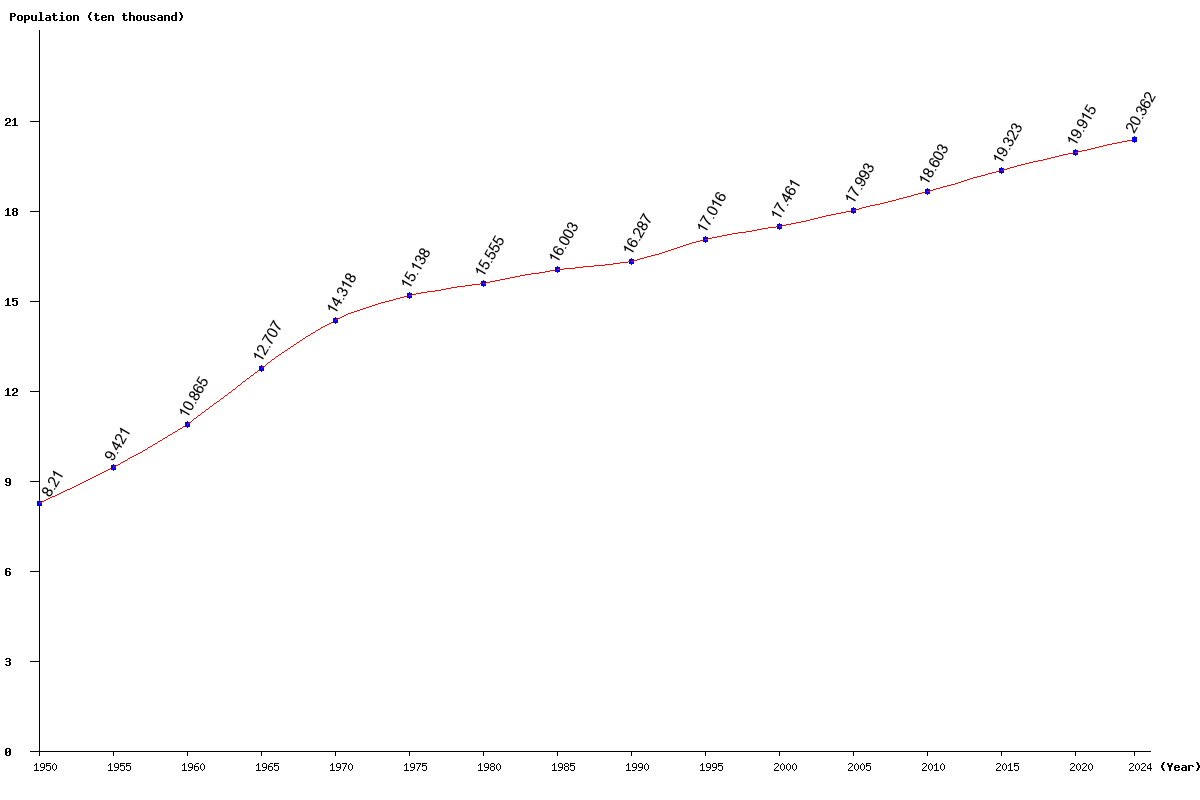
| Year | Population | Yearly % Change |
Yearly Change |
Sex ratio | Density (P/Km²) |
|---|---|---|---|---|---|
| 2025 | 204,702 | 0.53 | 1,084 | 106.60 | 72.33 |
| 2024 | 203,618 | 0.54 | 1,102 | 106.58 | 71.95 |
| 2023 | 202,516 | 0.55 | 1,117 | 106.57 | 71.56 |
| 2022 | 201,399 | 0.56 | 1,124 | 106.55 | 71.17 |
| 2021 | 200,275 | 0.56 | 1,123 | 106.54 | 70.77 |
| 2020 | 199,152 | 0.57 | 1,120 | 106.52 | 70.37 |
| 2019 | 198,032 | 0.57 | 1,130 | 106.51 | 69.98 |
| 2018 | 196,902 | 0.59 | 1,159 | 106.50 | 69.58 |
| 2017 | 195,743 | 0.63 | 1,220 | 106.50 | 69.17 |
| 2016 | 194,523 | 0.67 | 1,295 | 106.49 | 68.74 |
| 2015 | 193,228 | 0.72 | 1,383 | 106.48 | 68.28 |
| 2014 | 191,845 | 0.76 | 1,455 | 106.46 | 67.79 |
| 2013 | 190,390 | 0.79 | 1,489 | 106.44 | 67.28 |
| 2012 | 188,901 | 0.78 | 1,467 | 106.43 | 66.75 |
| 2011 | 187,434 | 0.76 | 1,405 | 106.45 | 66.23 |
| 2010 | 186,029 | 0.72 | 1,329 | 106.52 | 65.73 |
| 2005 | 179,928 | 3.04 | 5,314 | 107.43 | 63.58 |
| 2000 | 174,614 | 2.62 | 4,456 | 108.66 | 61.70 |
| 1995 | 170,158 | 4.48 | 7,293 | 108.35 | 60.13 |
| 1990 | 162,865 | 1.77 | 2,835 | 109.19 | 57.55 |
| 1985 | 160,030 | 2.88 | 4,476 | 108.16 | 56.55 |
| 1980 | 155,554 | 2.76 | 4,171 | 104.68 | 54.97 |
| 1975 | 151,383 | 5.73 | 8,208 | 103.02 | 53.49 |
| 1970 | 143,175 | 12.68 | 16,107 | 103.90 | 50.59 |
| 1965 | 127,068 | 16.96 | 18,423 | 102.88 | 44.90 |
| 1960 | 108,645 | 15.32 | 14,436 | 103.08 | 38.39 |
| 1955 | 94,209 | 14.75 | 12,107 | 104.78 | 33.29 |
| 1950 | 82,102 | 106.50 | 29.01 |