Philippines population
120,997,864
Births this year: 24,635,069
Births today 5,259
Deaths this year 6,261,413
Deaths today 1,337
120,997,864
| Region Name | Percents | Number |
|---|---|---|
| Catholic (Roman Catholic, Aglipayan) | 82.9% | 85,075,469 people |
| Muslim | 5% | 5,131,210 people |
| Evangelical | 2.8% | 2,873,478 people |
| Iglesia ni Kristo | 2.3% | 2,360,357 people |
| other Christian | 4.5% | 4,618,089 people |
| other | 1.8% | 1,847,236 people |
| unspecified | 0.6% | 615,745 people |
| none | 0.1% | 102,624 people |
| Ethnic groups Name | Percents | Number |
|---|---|---|
| Tagalog | 28.1% | 28,837,403 people |
| Cebuano | 13.1% | 13,443,771 people |
| Ilocano | 9% | 9,236,179 people |
| Bisaya/Binisaya | 7.6% | 7,799,440 people |
| Hiligaynon Ilonggo | 7.5% | 7,696,816 people |
| Bikol | 6% | 6,157,453 people |
| Waray | 3.4% | 3,489,223 people |
| other | 25.3% | 25,963,925 people |
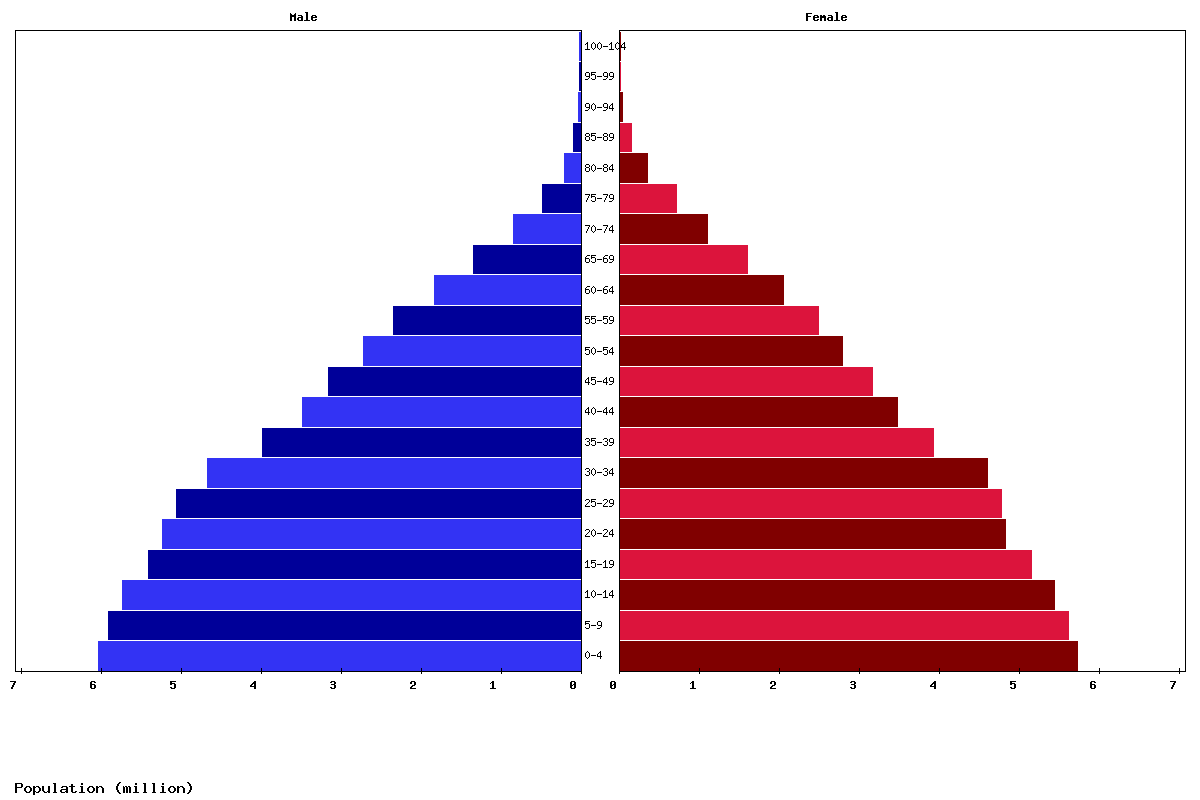
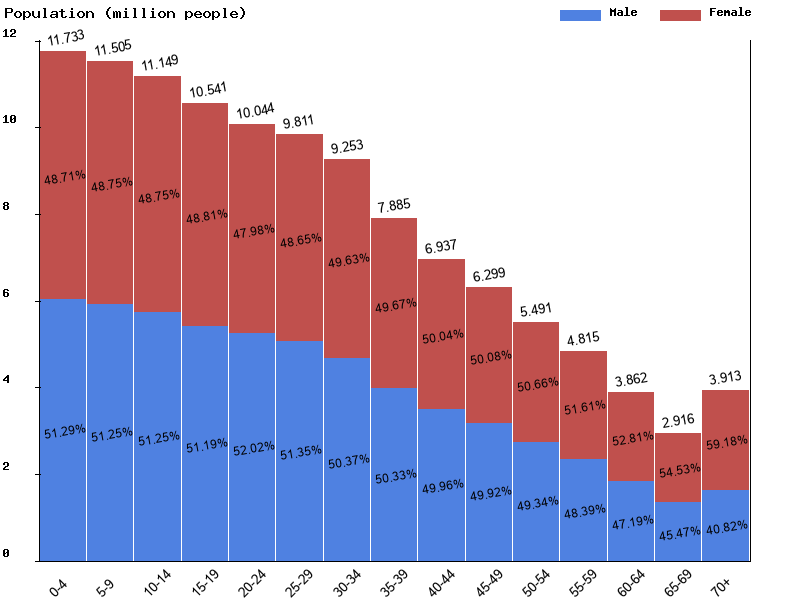
| Age | Both Sexes Population | Male Population | Female Population | Both Sexes (%) | Male (%) | Female (%) | Sex ratio (female/male) |
|---|---|---|---|---|---|---|---|
| Total | 116,151,399 | 58,308,052 | 57,843,347 | 100 | 100 | 100 | 100.8 |
| 00-04 | 11,732,606 | 6,017,222 | 5,715,384 | 10.1 | 10.3 | 9.9 | 105.3 |
| 05-09 | 11,505,289 | 5,896,444 | 5,608,845 | 9.9 | 10.1 | 9.7 | 105.1 |
| 10-14 | 11,148,781 | 5,713,575 | 5,435,206 | 9.6 | 9.8 | 9.4 | 105.1 |
| 15-19 | 10,540,501 | 5,395,190 | 5,145,311 | 9.1 | 9.3 | 8.9 | 104.9 |
| 20-24 | 10,044,217 | 5,224,539 | 4,819,678 | 8.6 | 9 | 8.3 | 108.4 |
| 25-29 | 9,811,054 | 5,038,354 | 4,772,700 | 8.4 | 8.6 | 8.3 | 105.6 |
| 30-34 | 9,253,199 | 4,660,842 | 4,592,357 | 8 | 8 | 7.9 | 101.5 |
| 35-39 | 7,884,552 | 3,968,240 | 3,916,312 | 6.8 | 6.8 | 6.8 | 101.3 |
| 40-44 | 6,936,544 | 3,465,332 | 3,471,212 | 6 | 5.9 | 6 | 99.8 |
| 45-49 | 6,298,508 | 3,144,345 | 3,154,163 | 5.4 | 5.4 | 5.5 | 99.7 |
| 50-54 | 5,490,506 | 2,708,781 | 2,781,725 | 4.7 | 4.6 | 4.8 | 97.4 |
| 55-59 | 4,815,069 | 2,329,792 | 2,485,277 | 4.1 | 4 | 4.3 | 93.7 |
| 60-64 | 3,861,841 | 1,822,238 | 2,039,603 | 3.3 | 3.1 | 3.5 | 89.3 |
| 65-69 | 2,916,149 | 1,325,893 | 1,590,256 | 2.5 | 2.3 | 2.7 | 83.4 |
| 70-74 | 1,925,032 | 836,776 | 1,088,256 | 1.7 | 1.4 | 1.9 | 76.9 |
| 75-79 | 1,177,136 | 466,105 | 711,031 | 1 | 0.8 | 1.2 | 65.6 |
| 80-84 | 541,457 | 199,071 | 342,386 | 0.5 | 0.3 | 0.6 | 58.1 |
| 85-89 | 216,875 | 76,152 | 140,723 | 0.2 | 0.1 | 0.2 | 54.1 |
| 90-94 | 46,803 | 17,108 | 29,695 | 0 | 0 | 0.1 | 57.6 |
| 95-99 | 5,011 | 1,929 | 3,082 | 0 | 0 | 0 | 62.6 |
| 100+ | 269 | 124 | 145 | 0 | 0 | 0 | 85.5 |
| Year | Population | Yearly % Change |
Yearly Change |
Sex ratio | Density (P/Km²) |
|---|---|---|---|---|---|
| 2025 | 116,151,399 | 1.33 | 1,527,550 | 100.80 | 389.55 |
| 2024 | 114,623,849 | 1.36 | 1,538,766 | 100.91 | 384.42 |
| 2023 | 113,085,083 | 1.39 | 1,546,750 | 101.02 | 379.26 |
| 2022 | 111,538,333 | 1.41 | 1,550,813 | 101.13 | 374.08 |
| 2021 | 109,987,520 | 1.43 | 1,551,732 | 101.23 | 368.88 |
| 2020 | 108,435,788 | 1.45 | 1,549,152 | 101.34 | 363.67 |
| 2019 | 106,886,636 | 1.47 | 1,545,574 | 101.44 | 358.48 |
| 2018 | 105,341,062 | 1.49 | 1,544,230 | 101.54 | 353.29 |
| 2017 | 103,796,832 | 1.51 | 1,546,699 | 101.63 | 348.11 |
| 2016 | 102,250,133 | 1.54 | 1,550,738 | 101.74 | 342.93 |
| 2015 | 100,699,395 | 1.57 | 1,560,705 | 101.86 | 337.72 |
| 2014 | 99,138,690 | 1.61 | 1,567,014 | 102.00 | 332.49 |
| 2013 | 97,571,676 | 1.62 | 1,554,354 | 102.16 | 327.24 |
| 2012 | 96,017,322 | 1.60 | 1,516,089 | 102.31 | 322.02 |
| 2011 | 94,501,233 | 1.57 | 1,462,331 | 102.38 | 316.94 |
| 2010 | 93,038,902 | 1.52 | 1,397,021 | 102.35 | 312.03 |
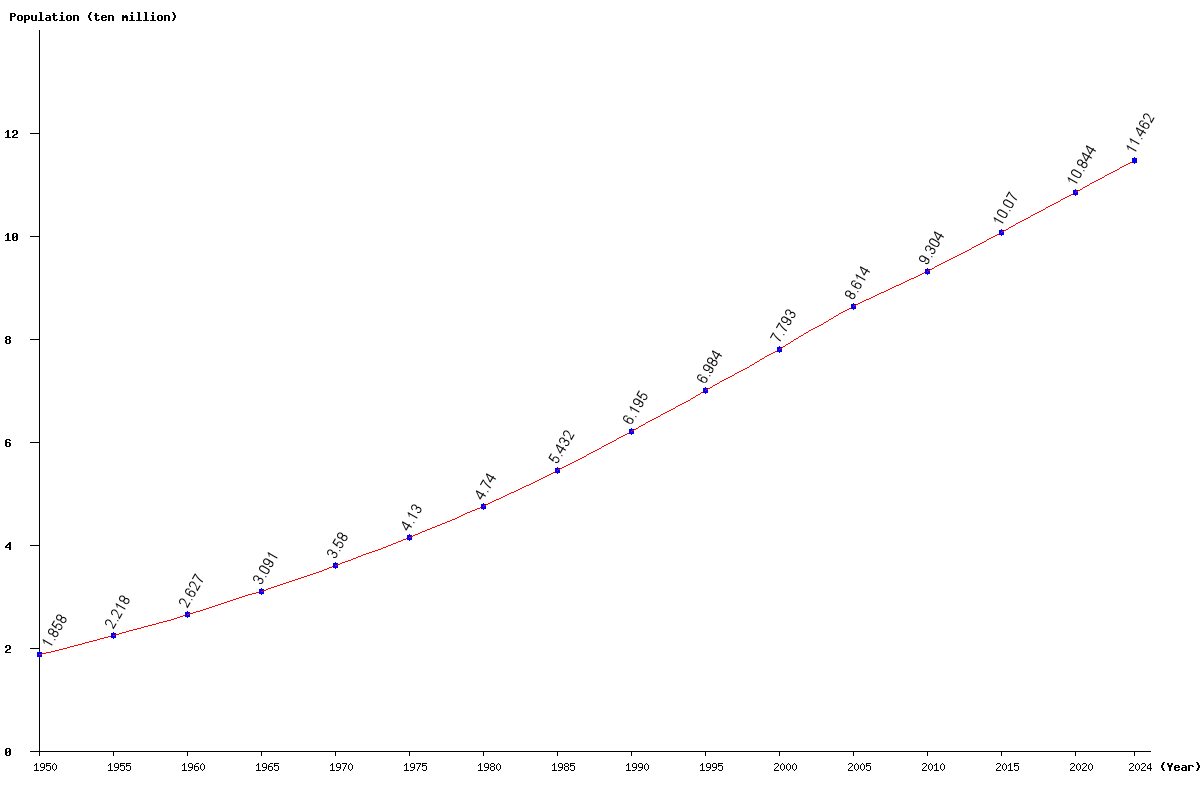
| 2005 | 86,141,373 | 10.53 | 8,209,126 | 101.04 | 288.90 |
| 2000 | 77,932,247 | 11.59 | 8,096,534 | 101.46 | 261.37 |
| 1995 | 69,835,713 | 12.73 | 7,888,373 | 101.78 | 234.21 |
| 1990 | 61,947,340 | 14.03 | 7,623,689 | 102.08 | 207.76 |
| 1985 | 54,323,651 | 14.61 | 6,926,685 | 102.24 | 182.19 |
| 1980 | 47,396,966 | 14.78 | 6,101,837 | 102.37 | 158.96 |
| 1975 | 41,295,129 | 15.33 | 5,490,398 | 102.49 | 138.50 |
| 1970 | 35,804,731 | 15.82 | 4,890,800 | 102.39 | 120.08 |
| 1965 | 30,913,931 | 17.66 | 4,640,908 | 102.10 | 103.68 |
| 1960 | 26,273,023 | 18.46 | 4,093,920 | 101.31 | 88.11 |
| 1955 | 22,179,103 | 19.37 | 3,598,616 | 100.26 | 74.38 |
| 1950 | 18,580,487 | 98.91 | 62.32 |