Peru population
30,449,306
Births this year: 0
Births today 0
Deaths this year 291,756
Deaths today 38
30,449,306
| Region Name | Percents | Number |
|---|---|---|
| Roman Catholic | 81.3% | 24,992,483 people |
| Evangelical | 12.5% | 3,842,633 people |
| other | 3.3% | 1,014,455 people |
| none | 2.9% | 891,491 people |
| Ethnic groups Name | Percents | Number |
|---|---|---|
| Amerindian | 45% | 13,833,478 people |
| mestizo (mixed Amerindian and white) | 37% | 11,374,193 people |
| white | 15% | 4,611,159 people |
| black, Japanese, Chinese, and other | 3% | 922,232 people |
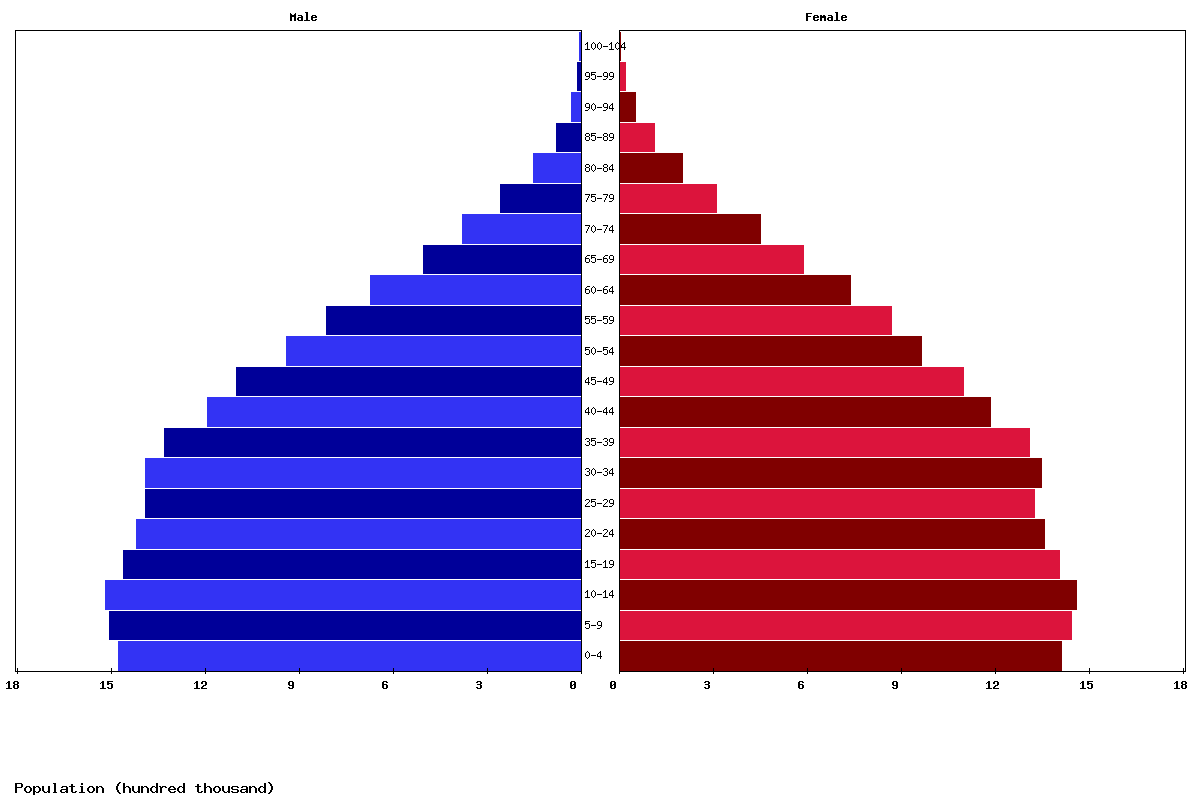
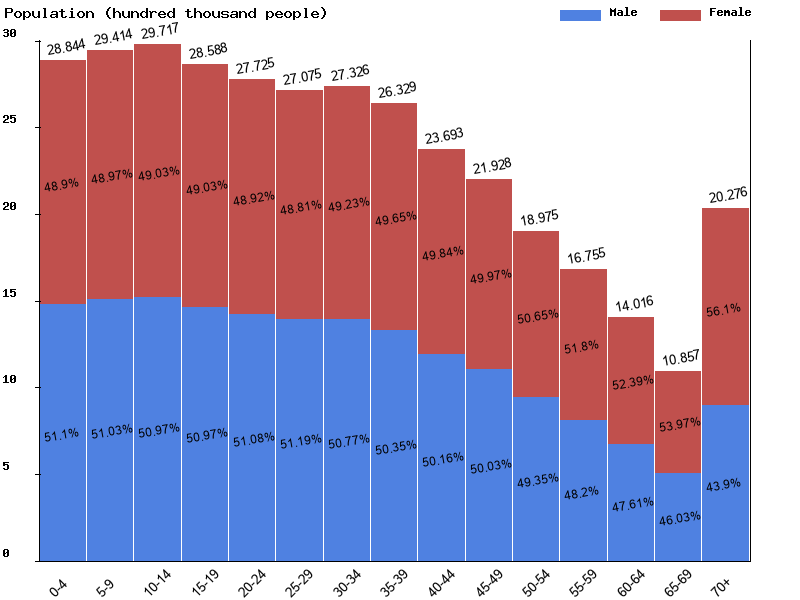
| Age | Both Sexes Population | Male Population | Female Population | Both Sexes (%) | Male (%) | Female (%) | Sex ratio (female/male) |
|---|---|---|---|---|---|---|---|
| Total | 35,151,871 | 17,548,588 | 17,603,283 | 100 | 100 | 100 | 99.7 |
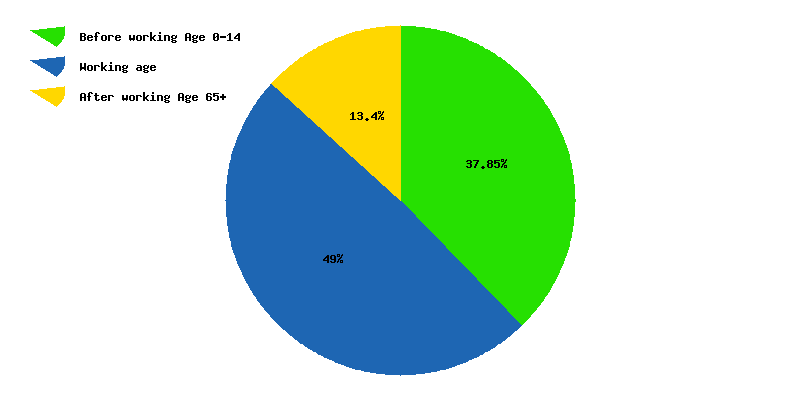
| 00-04 | 2,884,433 | 1,473,974 | 1,410,459 | 8.2 | 8.4 | 8 | 104.5 |
| 05-09 | 2,941,388 | 1,501,028 | 1,440,360 | 8.4 | 8.6 | 8.2 | 104.2 |
| 10-14 | 2,971,701 | 1,514,568 | 1,457,133 | 8.5 | 8.6 | 8.3 | 103.9 |
| 15-19 | 2,858,841 | 1,457,144 | 1,401,697 | 8.1 | 8.3 | 8 | 104 |
| 20-24 | 2,772,488 | 1,416,223 | 1,356,265 | 7.9 | 8.1 | 7.7 | 104.4 |
| 25-29 | 2,707,548 | 1,386,041 | 1,321,507 | 7.7 | 7.9 | 7.5 | 104.9 |
| 30-34 | 2,732,612 | 1,387,338 | 1,345,274 | 7.8 | 7.9 | 7.6 | 103.1 |
| 35-39 | 2,632,855 | 1,325,709 | 1,307,146 | 7.5 | 7.6 | 7.4 | 101.4 |
| 40-44 | 2,369,319 | 1,188,375 | 1,180,944 | 6.7 | 6.8 | 6.7 | 100.6 |
| 45-49 | 2,192,751 | 1,097,113 | 1,095,638 | 6.2 | 6.3 | 6.2 | 100.1 |
| 50-54 | 1,897,469 | 936,311 | 961,158 | 5.4 | 5.3 | 5.5 | 97.4 |
| 55-59 | 1,675,462 | 807,599 | 867,863 | 4.8 | 4.6 | 4.9 | 93.1 |
| 60-64 | 1,401,634 | 667,248 | 734,386 | 4 | 3.8 | 4.2 | 90.9 |
| 65-69 | 1,085,733 | 499,806 | 585,927 | 3.1 | 2.8 | 3.3 | 85.3 |
| 70-74 | 823,325 | 373,961 | 449,364 | 2.3 | 2.1 | 2.6 | 83.2 |
| 75-79 | 561,792 | 252,927 | 308,865 | 1.6 | 1.4 | 1.8 | 81.9 |
| 80-84 | 348,052 | 149,967 | 198,085 | 1 | 0.9 | 1.1 | 75.7 |
| 85-89 | 187,628 | 76,022 | 111,606 | 0.5 | 0.4 | 0.6 | 68.1 |
| 90-94 | 77,831 | 28,560 | 49,271 | 0.2 | 0.2 | 0.3 | 58 |
| 95-99 | 24,736 | 7,278 | 17,458 | 0.1 | 0 | 0.1 | 41.7 |
| 100+ | 4,273 | 1,396 | 2,877 | 0 | 0 | 0 | 48.5 |
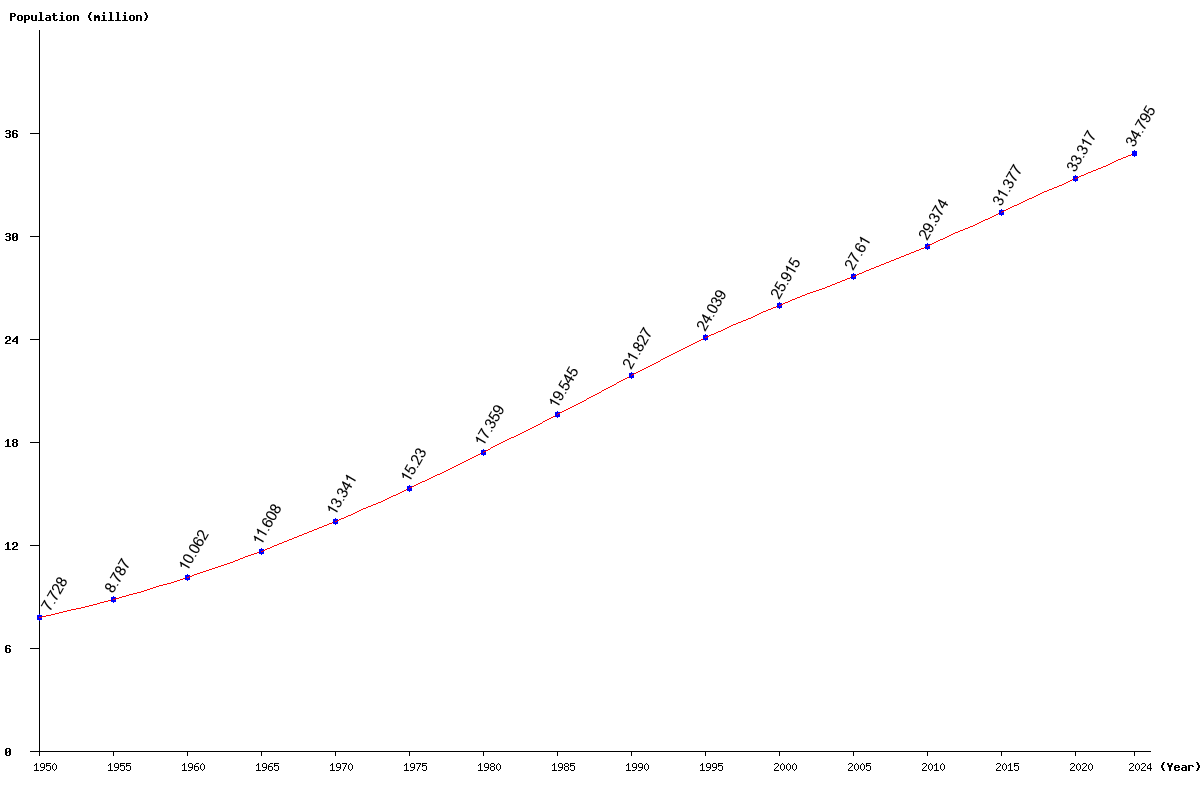
| Year | Population | Yearly % Change |
Yearly Change |
Sex ratio | Density (P/Km²) |
|---|---|---|---|---|---|
| 2025 | 35,151,871 | 1.03 | 357,341 | 99.69 | 27.46 |
| 2024 | 34,794,530 | 1.05 | 362,230 | 99.70 | 27.18 |
| 2023 | 34,432,300 | 1.08 | 367,018 | 99.71 | 26.90 |
| 2022 | 34,065,282 | 1.10 | 371,768 | 99.72 | 26.61 |
| 2021 | 33,693,514 | 1.13 | 376,403 | 99.74 | 26.32 |
| 2020 | 33,317,111 | 1.15 | 380,109 | 99.75 | 26.03 |
| 2019 | 32,937,002 | 1.18 | 383,305 | 99.76 | 25.73 |
| 2018 | 32,553,697 | 1.20 | 387,224 | 99.77 | 25.43 |
| 2017 | 32,166,473 | 1.23 | 392,248 | 99.78 | 25.13 |
| 2016 | 31,774,225 | 1.27 | 397,555 | 99.80 | 24.82 |
| 2015 | 31,376,670 | 1.30 | 403,522 | 99.81 | 24.51 |
| 2014 | 30,973,148 | 1.33 | 407,687 | 99.82 | 24.20 |
| 2013 | 30,565,461 | 1.35 | 406,693 | 99.83 | 23.88 |
| 2012 | 30,158,768 | 1.34 | 398,877 | 99.83 | 23.56 |
| 2011 | 29,759,891 | 1.31 | 386,247 | 99.84 | 23.25 |
| 2010 | 29,373,644 | 1.28 | 372,081 | 99.85 | 22.95 |
| 2005 | 27,610,406 | 6.54 | 1,695,531 | 99.87 | 21.57 |
| 2000 | 25,914,875 | 7.80 | 1,876,114 | 99.90 | 20.25 |
| 1995 | 24,038,761 | 10.13 | 2,212,103 | 99.90 | 18.78 |
| 1990 | 21,826,658 | 11.67 | 2,281,708 | 99.86 | 17.05 |
| 1985 | 19,544,950 | 12.59 | 2,185,832 | 100.00 | 15.27 |
| 1980 | 17,359,118 | 13.98 | 2,129,167 | 100.23 | 13.56 |
| 1975 | 15,229,951 | 14.16 | 1,888,880 | 100.56 | 11.90 |
| 1970 | 13,341,071 | 14.93 | 1,733,387 | 100.88 | 10.42 |
| 1965 | 11,607,684 | 15.37 | 1,546,165 | 101.03 | 9.07 |
| 1960 | 10,061,519 | 14.51 | 1,274,766 | 101.04 | 7.86 |
| 1955 | 8,786,753 | 13.70 | 1,059,018 | 101.00 | 6.86 |
| 1950 | 7,727,735 | 100.87 | 6.04 |