Palau population
22,013
Births this year: 2,332
Births today 0
Deaths this year 1,666
Deaths today 0
22,013
| Region Name | Percents | Number |
|---|---|---|
| Roman Catholic | 49.4% | 10,545 people |
| Protestant (includes Protestant (general), Seventh Day Adventist, and other Protestant) | 30.9% | 6,596 people |
| Modekngei | 8.7% | 1,857 people |
| other | 11% | 2,348 people |
| Ethnic groups Name | Percents | Number |
|---|---|---|
| Palauan (Micronesian with Malayan and Melanesian admixtures) | 72.5% | 15,477 people |
| Carolinian | 1% | 213 people |
| other Micronesian | 2.4% | 512 people |
| Filipino | 16.3% | 3,480 people |
| Chinese | 1.6% | 342 people |
| Vietnamese | 1.6% | 342 people |
| other Asian | 3.4% | 726 people |
| white | 0.9% | 192 people |
| other | 0.3% | 64 people |
| Year | Population | Yearly % Change |
Yearly Change |
Sex ratio | Density (P/Km²) |
|---|---|---|---|---|---|
| 2025 | 23,642 | 1.01 | 237 | 101.46 | 51.40 |
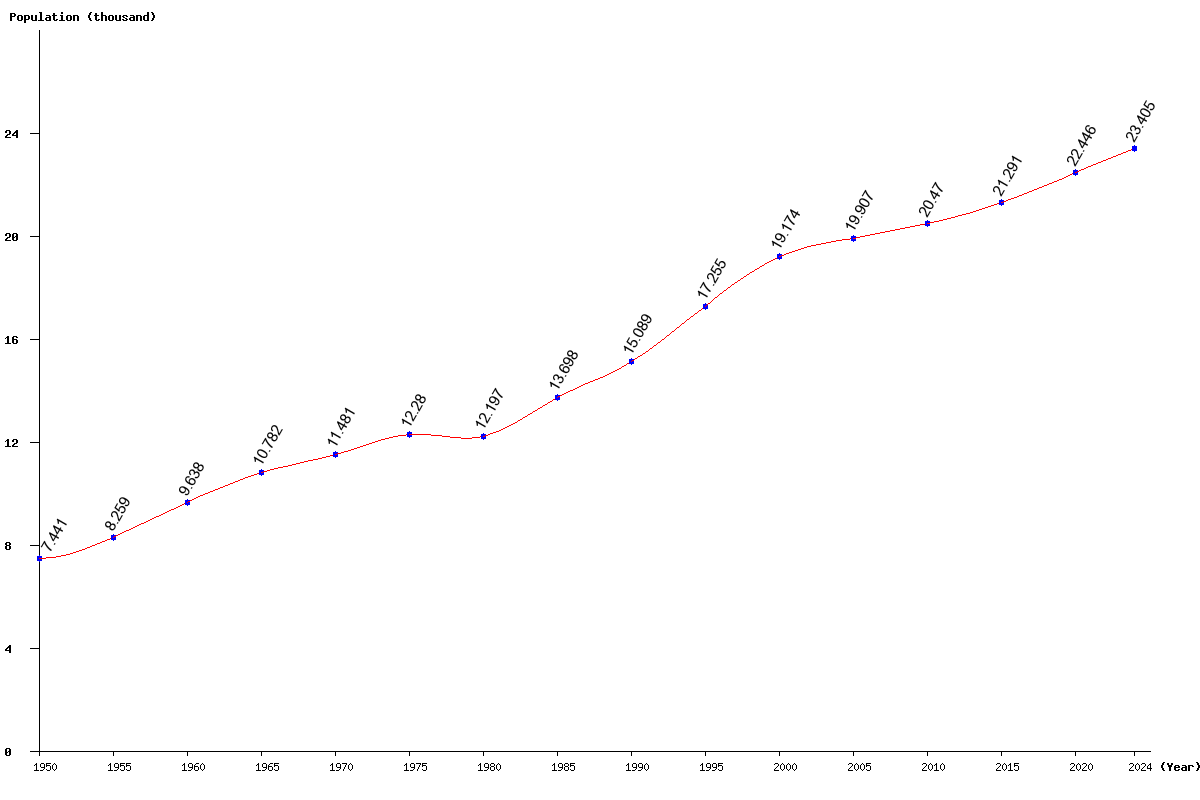
| 2024 | 23,405 | 1.03 | 238 | 101.42 | 50.88 |
| 2023 | 23,167 | 1.04 | 239 | 101.37 | 50.36 |
| 2022 | 22,928 | 1.06 | 240 | 101.31 | 49.84 |
| 2021 | 22,688 | 1.08 | 242 | 101.25 | 49.32 |
| 2020 | 22,446 | 1.09 | 243 | 101.18 | 48.80 |
| 2019 | 22,203 | 1.10 | 241 | 101.09 | 48.27 |
| 2018 | 21,962 | 1.09 | 236 | 101.00 | 47.74 |
| 2017 | 21,726 | 1.05 | 225 | 100.89 | 47.23 |
| 2016 | 21,501 | 0.99 | 210 | 100.77 | 46.74 |
| 2015 | 21,291 | 0.92 | 194 | 100.64 | 46.28 |
| 2014 | 21,097 | 0.85 | 178 | 100.50 | 45.86 |
| 2013 | 20,919 | 0.79 | 163 | 100.35 | 45.48 |
| 2012 | 20,756 | 0.73 | 150 | 100.19 | 45.12 |
| 2011 | 20,606 | 0.66 | 136 | 100.02 | 44.80 |
| 2010 | 20,470 | 0.62 | 126 | 99.84 | 44.50 |
| 2005 | 19,907 | 3.82 | 733 | 98.84 | 43.28 |
| 2000 | 19,174 | 11.12 | 1,919 | 97.79 | 41.68 |
| 1995 | 17,255 | 14.35 | 2,166 | 97.87 | 37.51 |
| 1990 | 15,089 | 10.15 | 1,391 | 97.41 | 32.80 |
| 1985 | 13,698 | 12.31 | 1,501 | 95.09 | 29.78 |
| 1980 | 12,197 | -0.68 | -83 | 93.47 | 26.52 |
| 1975 | 12,280 | 6.96 | 799 | 91.37 | 26.70 |
| 1970 | 11,481 | 6.48 | 699 | 89.79 | 24.96 |
| 1965 | 10,782 | 11.87 | 1,144 | 88.53 | 23.44 |
| 1960 | 9,638 | 16.70 | 1,379 | 86.56 | 20.95 |
| 1955 | 8,259 | 10.99 | 818 | 85.29 | 17.95 |
| 1950 | 7,441 | 84.68 | 16.18 |