North Europe population
0
Births this year: 0
Births today 0
Deaths this year 0
Deaths today 0
0
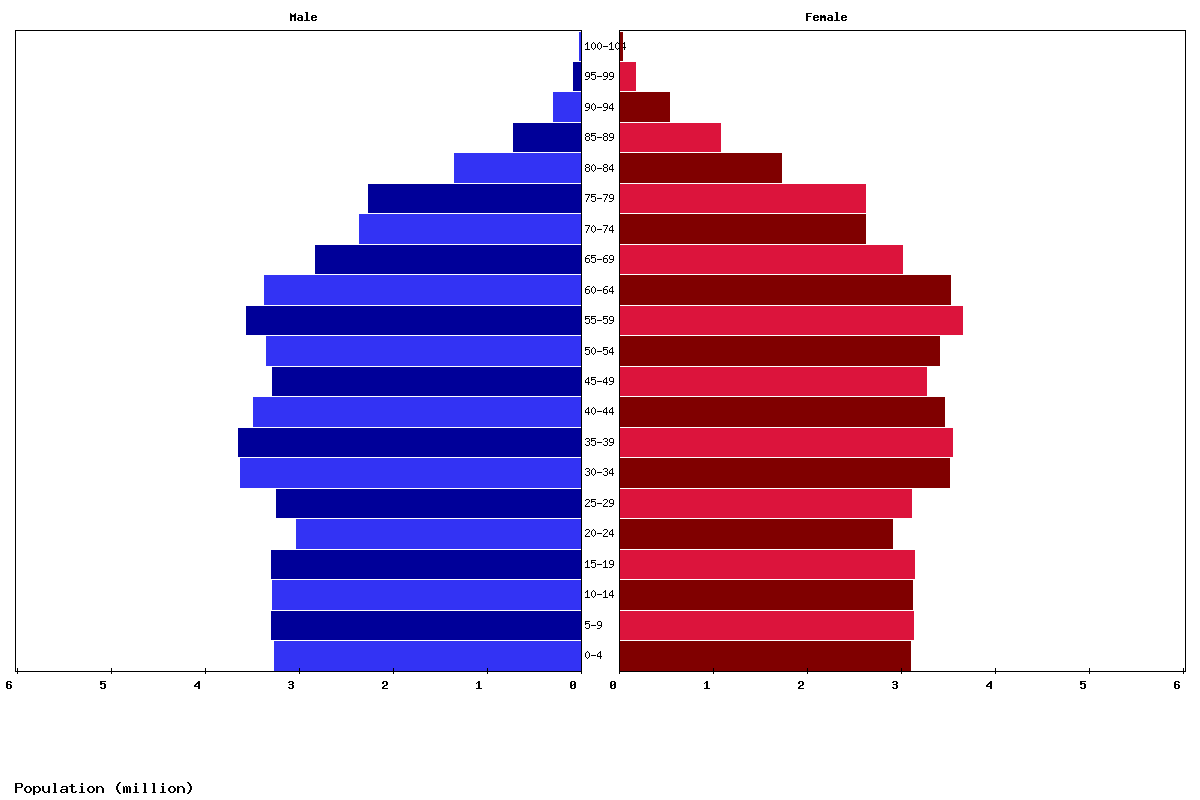
| Age | Both Sexes Population | Male Population | Female Population | Both Sexes (%) | Male (%) | Female (%) | Sex ratio (female/male) |
|---|---|---|---|---|---|---|---|
| Total | 107,840,468 | 53,353,880 | 54,486,588 | 100 | 100 | 100 | 97.9 |
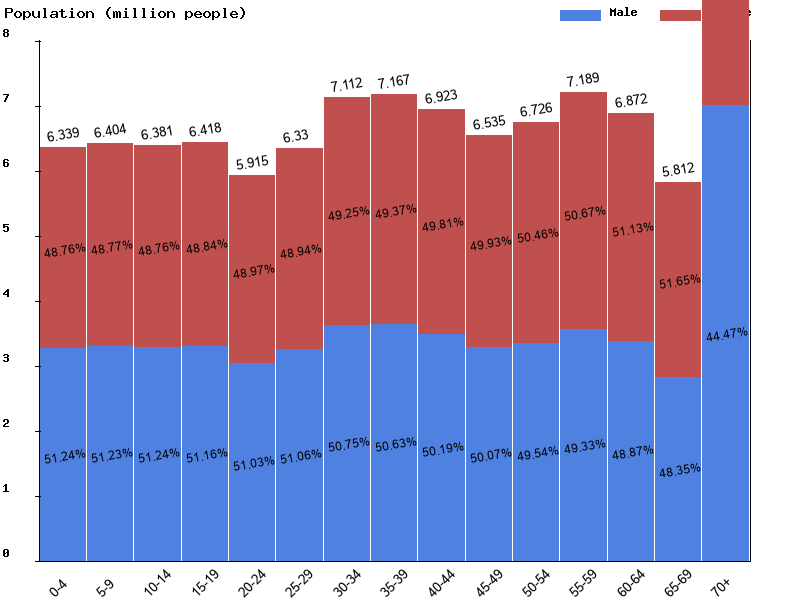
| 00-04 | 6,339,431 | 3,248,462 | 3,090,969 | 5.9 | 6.1 | 5.7 | 105.1 |
| 05-09 | 6,404,157 | 3,280,773 | 3,123,384 | 5.9 | 6.1 | 5.7 | 105 |
| 10-14 | 6,380,919 | 3,269,598 | 3,111,321 | 5.9 | 6.1 | 5.7 | 105.1 |
| 15-19 | 6,417,654 | 3,283,576 | 3,134,078 | 6 | 6.2 | 5.8 | 104.8 |
| 20-24 | 5,915,187 | 3,018,624 | 2,896,563 | 5.5 | 5.7 | 5.3 | 104.2 |
| 25-29 | 6,329,679 | 3,232,124 | 3,097,555 | 5.9 | 6.1 | 5.7 | 104.3 |
| 30-34 | 7,111,801 | 3,609,198 | 3,502,603 | 6.6 | 6.8 | 6.4 | 103 |
| 35-39 | 7,166,831 | 3,628,389 | 3,538,442 | 6.6 | 6.8 | 6.5 | 102.5 |
| 40-44 | 6,923,239 | 3,474,689 | 3,448,550 | 6.4 | 6.5 | 6.3 | 100.8 |
| 45-49 | 6,535,379 | 3,272,308 | 3,263,071 | 6.1 | 6.1 | 6 | 100.3 |
| 50-54 | 6,725,963 | 3,332,258 | 3,393,705 | 6.2 | 6.2 | 6.2 | 98.2 |
| 55-59 | 7,188,517 | 3,546,160 | 3,642,357 | 6.7 | 6.6 | 6.7 | 97.4 |
| 60-64 | 6,871,537 | 3,358,184 | 3,513,353 | 6.4 | 6.3 | 6.4 | 95.6 |
| 65-69 | 5,811,597 | 2,810,082 | 3,001,515 | 5.4 | 5.3 | 5.5 | 93.6 |
| 70-74 | 4,953,121 | 2,345,761 | 2,607,360 | 4.6 | 4.4 | 4.8 | 90 |
| 75-79 | 4,856,507 | 2,245,167 | 2,611,340 | 4.5 | 4.2 | 4.8 | 86 |
| 80-84 | 3,057,155 | 1,335,117 | 1,722,038 | 2.8 | 2.5 | 3.2 | 77.5 |
| 85-89 | 1,777,122 | 706,348 | 1,070,774 | 1.6 | 1.3 | 2 | 66 |
| 90-94 | 807,276 | 282,463 | 524,813 | 0.7 | 0.5 | 1 | 53.8 |
| 95-99 | 229,823 | 66,008 | 163,815 | 0.2 | 0.1 | 0.3 | 40.3 |
| 100+ | 37,573 | 8,591 | 28,982 | 0 | 0 | 0.1 | 29.6 |
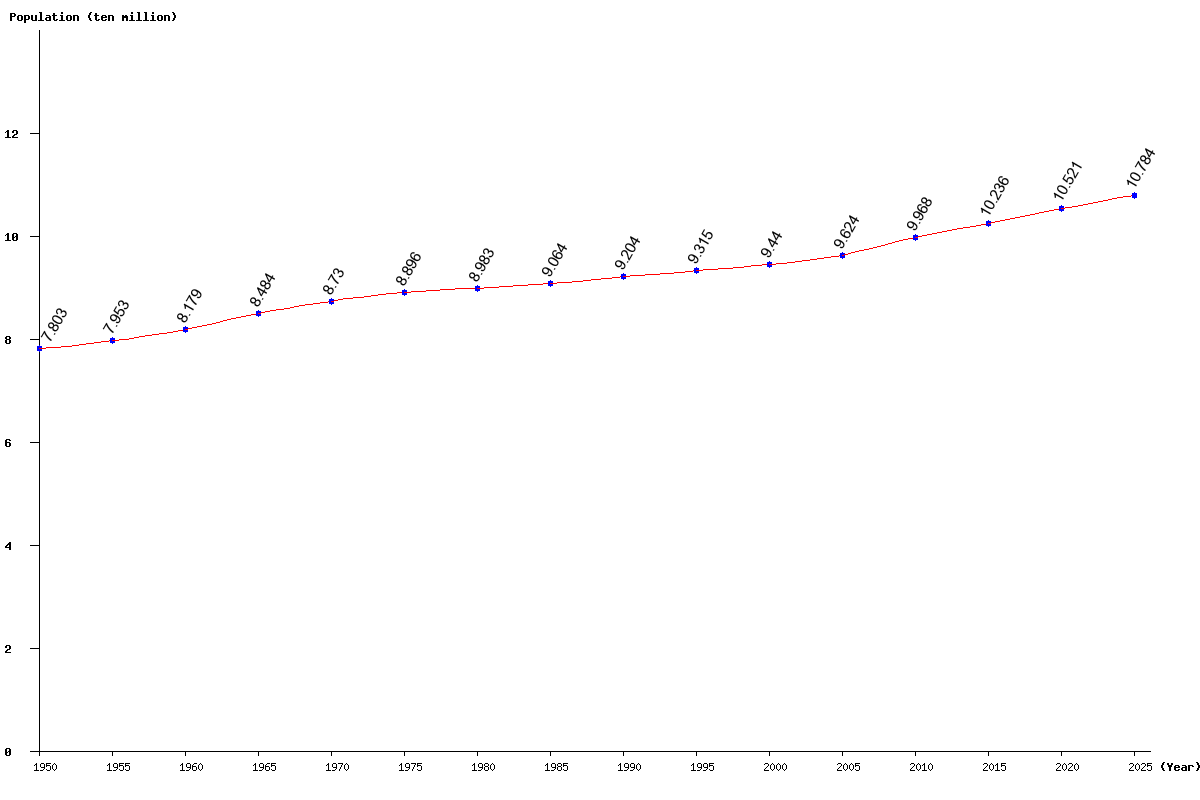
| Year | Population | Yearly % Change |
Yearly Change |
Sex ratio | Density (P/Km²) |
|---|---|---|---|---|---|
| 2025 | 107,840,468 | 0.47 | 500,254 | 97.92 | 63.35 |
| 2024 | 107,340,214 | 0.48 | 513,955 | 97.85 | 63.05 |
| 2023 | 106,826,259 | 0.50 | 527,245 | 97.78 | 62.75 |
| 2022 | 106,299,014 | 0.51 | 539,993 | 97.71 | 62.44 |
| 2021 | 105,759,021 | 0.52 | 551,637 | 97.64 | 62.12 |
| 2020 | 105,207,384 | 0.54 | 565,659 | 97.56 | 61.80 |
| 2019 | 104,641,725 | 0.56 | 578,107 | 97.48 | 61.47 |
| 2018 | 104,063,618 | 0.56 | 581,012 | 97.40 | 61.13 |
| 2017 | 103,482,606 | 0.56 | 571,226 | 97.32 | 60.79 |
| 2016 | 102,911,380 | 0.54 | 553,612 | 97.23 | 60.45 |
| 2015 | 102,357,768 | 0.52 | 525,542 | 97.12 | 60.12 |
| 2014 | 101,832,226 | 0.50 | 502,257 | 97.00 | 59.82 |
| 2013 | 101,329,969 | 0.50 | 504,354 | 96.87 | 59.52 |
| 2012 | 100,825,615 | 0.54 | 541,860 | 96.73 | 59.22 |
| 2011 | 100,283,755 | 0.60 | 601,575 | 96.58 | 58.91 |
| 2010 | 99,682,180 | 0.68 | 673,504 | 96.45 | 58.55 |
| 2005 | 96,238,537 | 1.95 | 1,841,103 | 95.81 | 56.53 |
| 2000 | 94,397,434 | 1.34 | 1,244,118 | 95.10 | 55.45 |
| 1995 | 93,153,316 | 1.21 | 1,113,034 | 94.76 | 54.72 |
| 1990 | 92,040,282 | 1.54 | 1,396,267 | 94.74 | 54.06 |
| 1985 | 90,644,015 | 0.90 | 810,820 | 94.71 | 53.24 |
| 1980 | 89,833,195 | 0.98 | 876,042 | 94.90 | 52.77 |
| 1975 | 88,957,153 | 1.89 | 1,652,538 | 94.98 | 52.25 |
| 1970 | 87,304,615 | 2.91 | 2,466,016 | 94.75 | 51.28 |
| 1965 | 84,838,599 | 3.73 | 3,048,908 | 94.52 | 49.83 |
| 1960 | 81,789,691 | 2.84 | 2,261,661 | 93.82 | 48.04 |
| 1955 | 79,528,030 | 1.92 | 1,498,117 | 93.29 | 46.71 |
| 1950 | 78,029,913 | 92.96 | 45.83 |