North Africa population
0
Births this year: 0
Births today 0
Deaths this year 0
Deaths today 0
0
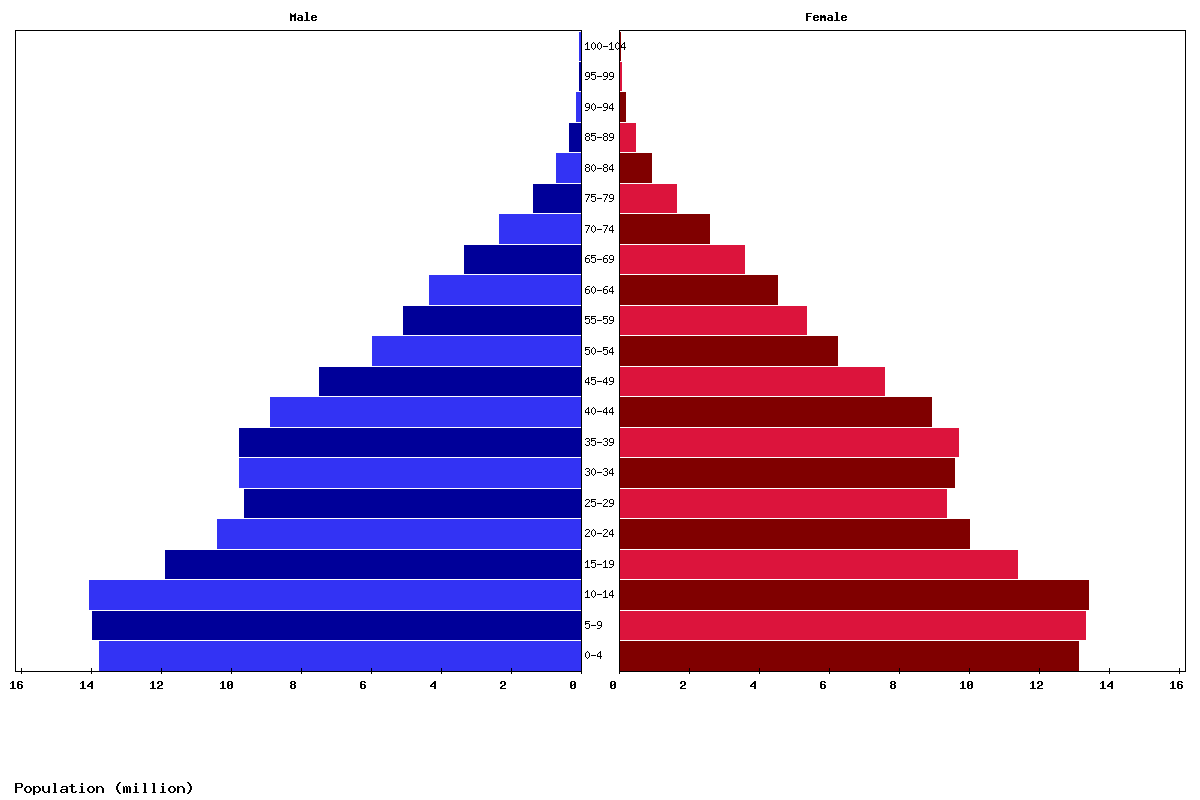
| Age | Both Sexes Population | Male Population | Female Population | Both Sexes (%) | Male (%) | Female (%) | Sex ratio (female/male) |
|---|---|---|---|---|---|---|---|
| Total | 263,892,089 | 132,470,156 | 131,421,933 | 100 | 100 | 100 | 100.8 |
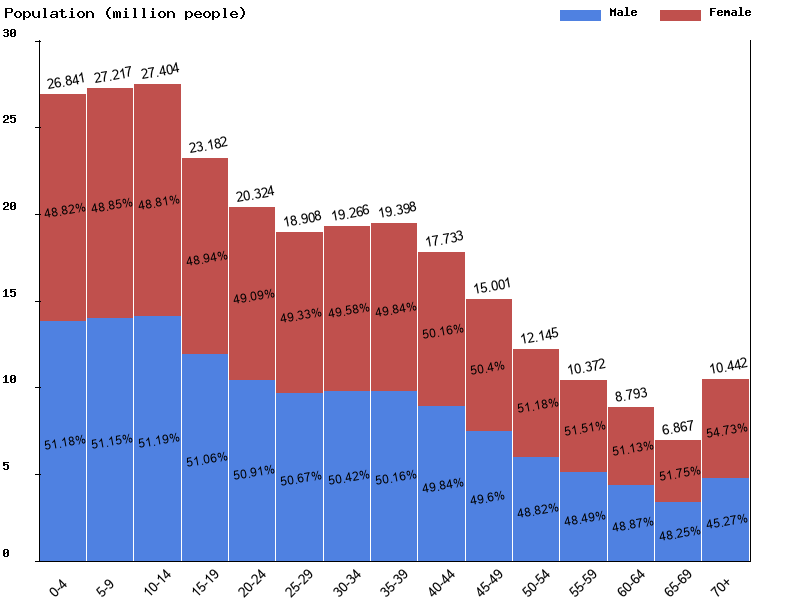
| 00-04 | 26,841,311 | 13,737,923 | 13,103,388 | 10.2 | 10.4 | 10 | 104.8 |
| 05-09 | 27,217,023 | 13,922,736 | 13,294,287 | 10.3 | 10.5 | 10.1 | 104.7 |
| 10-14 | 27,403,893 | 14,027,627 | 13,376,266 | 10.4 | 10.6 | 10.2 | 104.9 |
| 15-19 | 23,181,871 | 11,837,260 | 11,344,611 | 8.8 | 8.9 | 8.6 | 104.3 |
| 20-24 | 20,323,954 | 10,346,562 | 9,977,392 | 7.7 | 7.8 | 7.6 | 103.7 |
| 25-29 | 18,908,109 | 9,579,831 | 9,328,278 | 7.2 | 7.2 | 7.1 | 102.7 |
| 30-34 | 19,266,074 | 9,714,838 | 9,551,236 | 7.3 | 7.3 | 7.3 | 101.7 |
| 35-39 | 19,398,211 | 9,729,361 | 9,668,850 | 7.4 | 7.3 | 7.4 | 100.6 |
| 40-44 | 17,732,648 | 8,838,282 | 8,894,366 | 6.7 | 6.7 | 6.8 | 99.4 |
| 45-49 | 15,001,391 | 7,440,416 | 7,560,975 | 5.7 | 5.6 | 5.8 | 98.4 |
| 50-54 | 12,145,023 | 5,929,327 | 6,215,696 | 4.6 | 4.5 | 4.7 | 95.4 |
| 55-59 | 10,371,862 | 5,029,338 | 5,342,524 | 3.9 | 3.8 | 4.1 | 94.1 |
| 60-64 | 8,792,510 | 4,296,753 | 4,495,757 | 3.3 | 3.2 | 3.4 | 95.6 |
| 65-69 | 6,866,664 | 3,313,081 | 3,553,583 | 2.6 | 2.5 | 2.7 | 93.2 |
| 70-74 | 4,866,434 | 2,311,207 | 2,555,227 | 1.8 | 1.7 | 1.9 | 90.5 |
| 75-79 | 2,968,112 | 1,340,914 | 1,627,198 | 1.1 | 1 | 1.2 | 82.4 |
| 80-84 | 1,567,483 | 662,533 | 904,950 | 0.6 | 0.5 | 0.7 | 73.2 |
| 85-89 | 744,198 | 298,298 | 445,900 | 0.3 | 0.2 | 0.3 | 66.9 |
| 90-94 | 243,837 | 94,175 | 149,662 | 0.1 | 0.1 | 0.1 | 62.9 |
| 95-99 | 46,456 | 17,735 | 28,721 | 0 | 0 | 0 | 61.7 |
| 100+ | 5,025 | 1,959 | 3,066 | 0 | 0 | 0 | 63.9 |
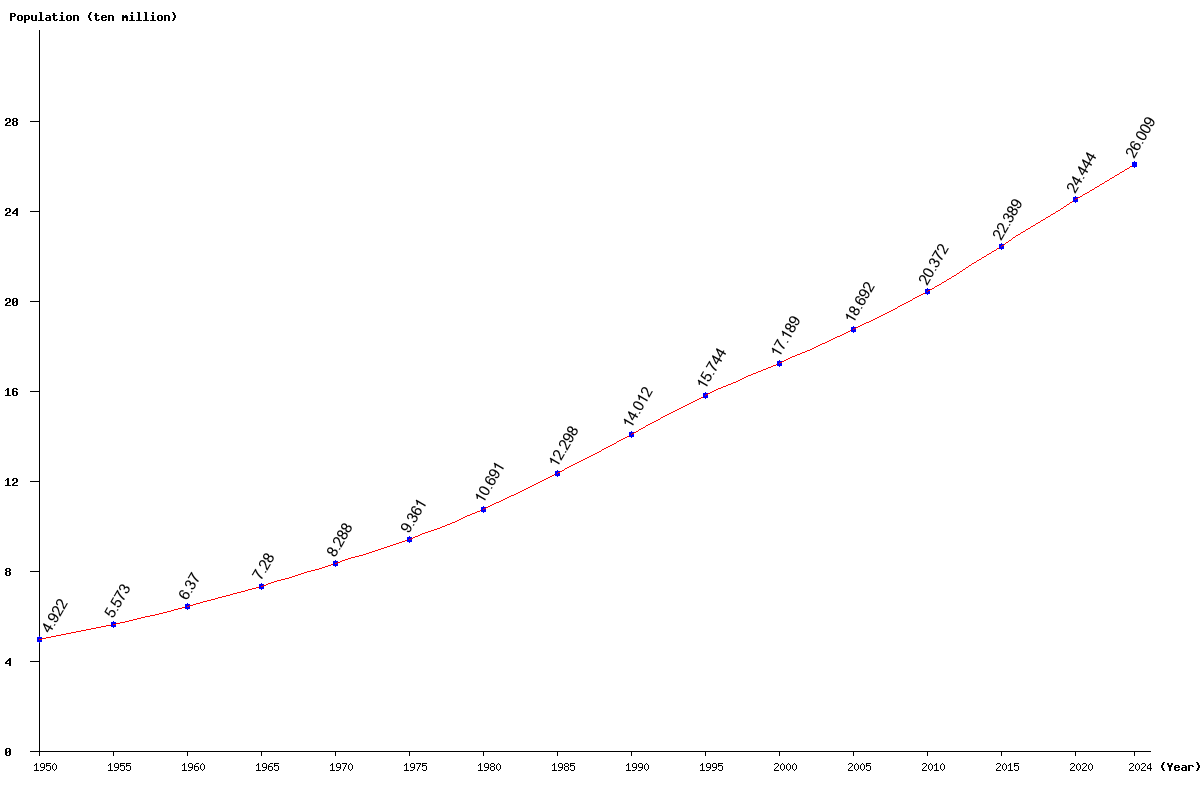
| Year | Population | Yearly % Change |
Yearly Change |
Sex ratio | Density (P/Km²) |
|---|---|---|---|---|---|
| 2025 | 263,892,089 | 1.46 | 3,800,306 | 100.80 | 33.97 |
| 2024 | 260,091,783 | 1.50 | 3,837,333 | 100.82 | 33.48 |
| 2023 | 256,254,450 | 1.54 | 3,881,916 | 100.84 | 32.98 |
| 2022 | 252,372,534 | 1.58 | 3,935,173 | 100.86 | 32.48 |
| 2021 | 248,437,361 | 1.63 | 3,992,406 | 100.88 | 31.98 |
| 2020 | 244,444,955 | 1.68 | 4,045,729 | 100.88 | 31.46 |
| 2019 | 240,399,226 | 1.73 | 4,089,600 | 100.88 | 30.94 |
| 2018 | 236,309,626 | 1.78 | 4,123,507 | 100.87 | 30.42 |
| 2017 | 232,186,119 | 1.82 | 4,144,400 | 100.86 | 29.88 |
| 2016 | 228,041,719 | 1.85 | 4,150,191 | 100.84 | 29.35 |
| 2015 | 223,891,528 | 1.89 | 4,155,875 | 100.82 | 28.82 |
| 2014 | 219,735,653 | 1.92 | 4,146,597 | 100.80 | 28.28 |
| 2013 | 215,589,056 | 1.93 | 4,089,485 | 100.77 | 27.75 |
| 2012 | 211,499,571 | 1.91 | 3,971,738 | 100.75 | 27.22 |
| 2011 | 207,527,833 | 1.87 | 3,811,100 | 100.74 | 26.71 |
| 2010 | 203,716,733 | 1.81 | 3,631,364 | 100.74 | 26.22 |
| 2005 | 186,917,286 | 8.74 | 15,026,435 | 100.87 | 24.06 |
| 2000 | 171,890,851 | 9.18 | 14,452,689 | 101.08 | 22.12 |
| 1995 | 157,438,162 | 12.36 | 17,321,549 | 101.29 | 20.26 |
| 1990 | 140,116,613 | 13.94 | 17,138,214 | 101.21 | 18.03 |
| 1985 | 122,978,399 | 15.03 | 16,070,814 | 101.14 | 15.83 |
| 1980 | 106,907,585 | 14.20 | 13,294,458 | 101.29 | 13.76 |
| 1975 | 93,613,127 | 12.95 | 10,730,605 | 101.21 | 12.05 |
| 1970 | 82,882,522 | 13.85 | 10,081,894 | 101.12 | 10.67 |
| 1965 | 72,800,628 | 14.29 | 9,103,755 | 101.10 | 9.37 |
| 1960 | 63,696,873 | 14.30 | 7,967,987 | 101.36 | 8.20 |
| 1955 | 55,728,886 | 13.22 | 6,507,010 | 101.23 | 7.17 |
| 1950 | 49,221,876 | 101.34 | 6.34 |