New Zealand population
4,738,120
Births this year: 594,151
Births today 14
Deaths this year 330,580
Deaths today 8
4,738,120
| Region Name | Percents | Number |
|---|---|---|
| Christian (Catholic, Anglican, Presbyterian and Congregational, Methodist, Pentecostal, other) | 44.3% | 1,982,225 people |
| Hindu | 2.1% | 93,966 people |
| Buddhist | 1.4% | 62,644 people |
| Maori Christian | 1.3% | 58,169 people |
| Islam | 1.1% | 49,220 people |
| other religion | 1.4% | 62,644 people |
| Ethnic groups Name | Percents | Number |
|---|---|---|
| European | 71.2% | 3,185,879 people |
| Maori | 14.1% | 630,911 people |
| Asian | 11.3% | 505,624 people |
| Pacific peoples | 7.6% | 340,066 people |
| Middle Eastern, Latin American, African | 1.1% | 49,220 people |
| other | 1.6% | 71,593 people |
| not stated or unidentified | 5.4% | 241,626 people |
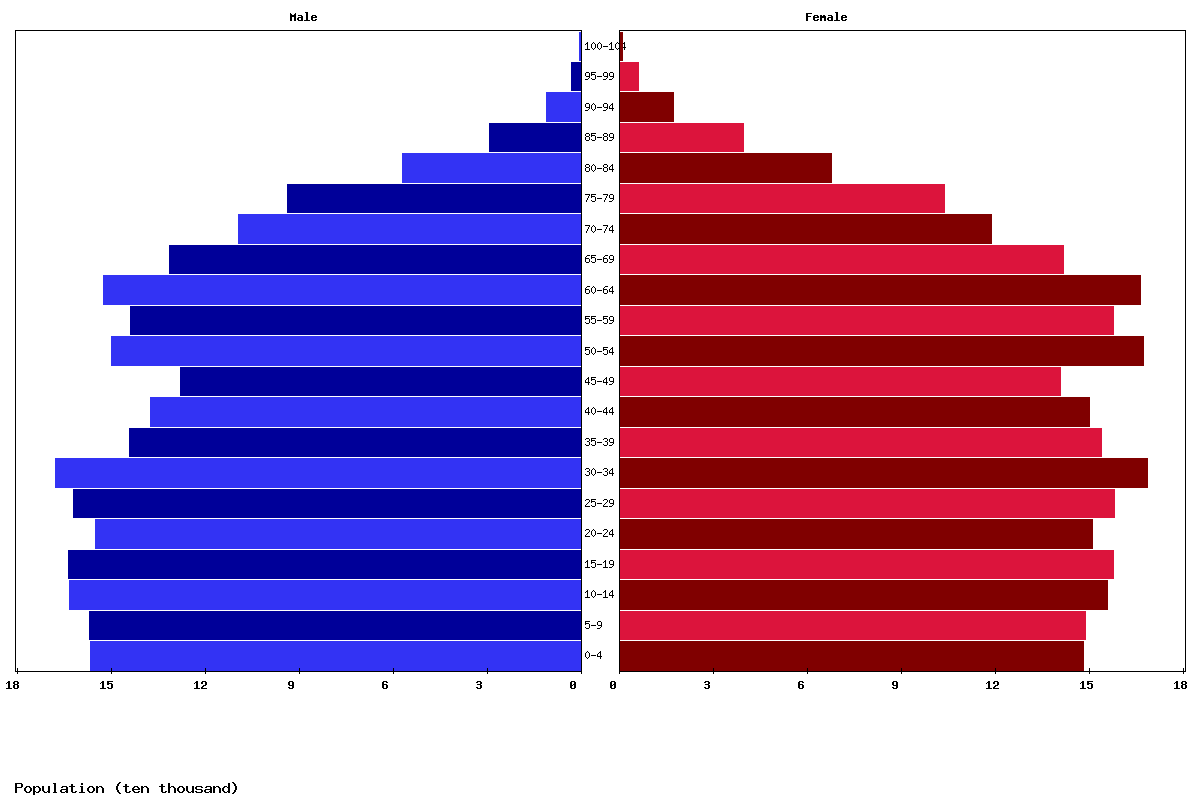
| Age | Both Sexes Population | Male Population | Female Population | Both Sexes (%) | Male (%) | Female (%) | Sex ratio (female/male) |
|---|---|---|---|---|---|---|---|
| Total | 4,922,923 | 2,407,909 | 2,515,014 | 100 | 100 | 100 | 95.7 |
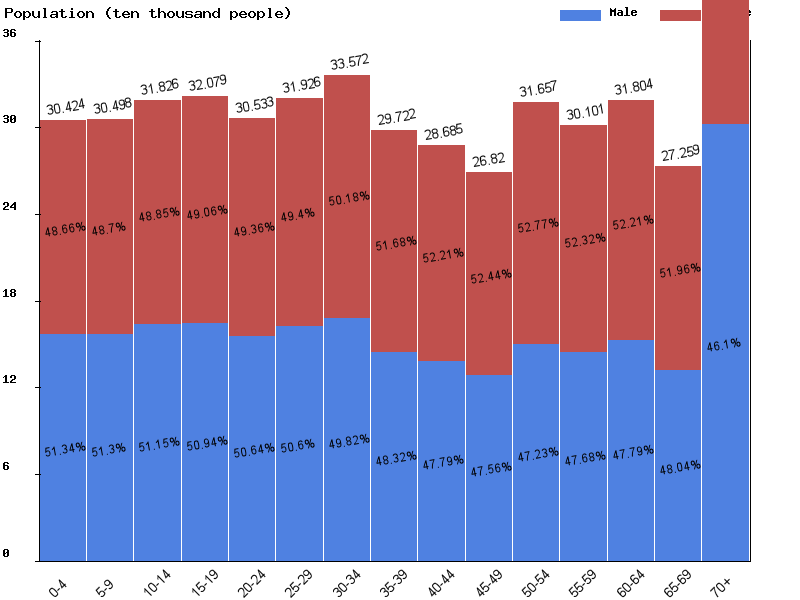
| 00-04 | 304,238 | 156,184 | 148,054 | 6.2 | 6.5 | 5.9 | 105.5 |
| 05-09 | 304,975 | 156,455 | 148,520 | 6.2 | 6.5 | 5.9 | 105.3 |
| 10-14 | 318,263 | 162,806 | 155,457 | 6.5 | 6.8 | 6.2 | 104.7 |
| 15-19 | 320,787 | 163,396 | 157,391 | 6.5 | 6.8 | 6.3 | 103.8 |
| 20-24 | 305,332 | 154,617 | 150,715 | 6.2 | 6.4 | 6 | 102.6 |
| 25-29 | 319,263 | 161,538 | 157,725 | 6.5 | 6.7 | 6.3 | 102.4 |
| 30-34 | 335,716 | 167,263 | 168,453 | 6.8 | 6.9 | 6.7 | 99.3 |
| 35-39 | 297,218 | 143,622 | 153,596 | 6 | 6 | 6.1 | 93.5 |
| 40-44 | 286,849 | 137,090 | 149,759 | 5.8 | 5.7 | 6 | 91.5 |
| 45-49 | 268,204 | 127,569 | 140,635 | 5.4 | 5.3 | 5.6 | 90.7 |
| 50-54 | 316,569 | 149,500 | 167,069 | 6.4 | 6.2 | 6.6 | 89.5 |
| 55-59 | 301,011 | 143,525 | 157,486 | 6.1 | 6 | 6.3 | 91.1 |
| 60-64 | 318,040 | 151,976 | 166,064 | 6.5 | 6.3 | 6.6 | 91.5 |
| 65-69 | 272,589 | 130,953 | 141,636 | 5.5 | 5.4 | 5.6 | 92.5 |
| 70-74 | 227,379 | 108,863 | 118,516 | 4.6 | 4.5 | 4.7 | 91.9 |
| 75-79 | 196,853 | 93,291 | 103,562 | 4 | 3.9 | 4.1 | 90.1 |
| 80-84 | 124,060 | 56,709 | 67,351 | 2.5 | 2.4 | 2.7 | 84.2 |
| 85-89 | 68,038 | 28,776 | 39,262 | 1.4 | 1.2 | 1.6 | 73.3 |
| 90-94 | 27,898 | 10,757 | 17,141 | 0.6 | 0.4 | 0.7 | 62.8 |
| 95-99 | 8,636 | 2,762 | 5,874 | 0.2 | 0.1 | 0.2 | 47 |
| 100+ | 1,005 | 257 | 748 | 0 | 0 | 0 | 34.4 |
| Year | Population | Yearly % Change |
Yearly Change |
Sex ratio | Density (P/Km²) |
|---|---|---|---|---|---|
| 2025 | 4,922,923 | 0.77 | 37,706 | 95.74 | 18.70 |
| 2024 | 4,885,217 | 0.78 | 37,997 | 95.73 | 18.55 |
| 2023 | 4,847,220 | 0.80 | 38,449 | 95.72 | 18.41 |
| 2022 | 4,808,771 | 0.82 | 39,151 | 95.71 | 18.26 |
| 2021 | 4,769,620 | 0.84 | 39,953 | 95.69 | 18.11 |
| 2020 | 4,729,667 | 0.88 | 41,110 | 95.67 | 17.96 |
| 2019 | 4,688,557 | 0.90 | 42,009 | 95.63 | 17.81 |
| 2018 | 4,646,548 | 0.91 | 41,677 | 95.57 | 17.65 |
| 2017 | 4,604,871 | 0.87 | 39,686 | 95.53 | 17.49 |
| 2016 | 4,565,185 | 0.81 | 36,659 | 95.53 | 17.34 |
| 2015 | 4,528,526 | 0.74 | 33,044 | 95.58 | 17.20 |
| 2014 | 4,495,482 | 0.68 | 30,206 | 95.72 | 17.07 |
| 2013 | 4,465,276 | 0.66 | 29,393 | 95.91 | 16.96 |
| 2012 | 4,435,883 | 0.71 | 31,400 | 96.14 | 16.85 |
| 2011 | 4,404,483 | 0.81 | 35,456 | 96.32 | 16.73 |
| 2010 | 4,369,027 | 0.92 | 39,903 | 96.41 | 16.59 |
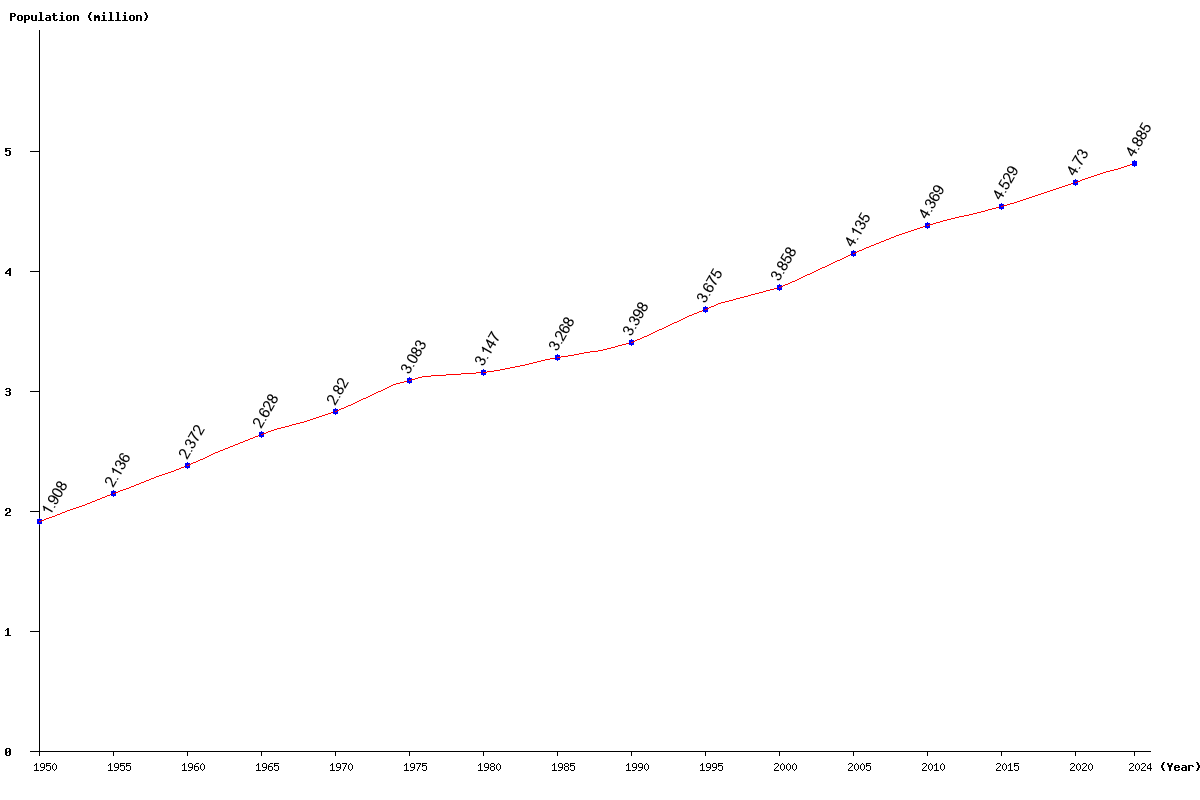
| 2005 | 4,134,699 | 7.17 | 276,465 | 95.97 | 15.70 |
| 2000 | 3,858,234 | 4.99 | 183,348 | 96.36 | 14.65 |
| 1995 | 3,674,886 | 8.16 | 277,352 | 97.15 | 13.96 |
| 1990 | 3,397,534 | 3.96 | 129,342 | 96.92 | 12.90 |
| 1985 | 3,268,192 | 3.86 | 121,421 | 98.12 | 12.41 |
| 1980 | 3,146,771 | 2.07 | 63,888 | 98.82 | 11.95 |
| 1975 | 3,082,883 | 9.34 | 263,335 | 99.51 | 11.71 |
| 1970 | 2,819,548 | 7.29 | 191,545 | 99.90 | 10.71 |
| 1965 | 2,628,003 | 10.79 | 256,004 | 100.65 | 9.98 |
| 1960 | 2,371,999 | 11.05 | 235,999 | 101.05 | 9.01 |
| 1955 | 2,136,000 | 11.95 | 227,999 | 101.38 | 8.11 |
| 1950 | 1,908,001 | 101.05 | 7.25 |