Nepal population
33,120,272
Births this year: 5,726,657
Births today 1,145
Deaths this year 1,640,299
Deaths today 328
33,120,272
| Region Name | Percents | Number |
|---|---|---|
| Hindu | 81.3% | 23,604,572 people |
| Buddhist | 9% | 2,613,052 people |
| Muslim | 4.4% | 1,277,492 people |
| Kirant | 3.1% | 900,051 people |
| Christian | 1.4% | 406,475 people |
| other | 0.5% | 145,170 people |
| unspecifed | 0.2% | 58,068 people |
| Ethnic groups Name | Percents | Number |
|---|---|---|
| Chhettri | 16.6% | 4,819,630 people |
| Brahman-Hill | 12.2% | 3,542,138 people |
| Magar | 7.1% | 2,061,408 people |
| Tharu | 6.6% | 1,916,238 people |
| Tamang | 5.8% | 1,683,967 people |
| Newar | 5% | 1,451,696 people |
| Kami | 4.8% | 1,393,628 people |
| Muslim | 4.4% | 1,277,492 people |
| Yadav | 4% | 1,161,357 people |
| Rai | 2.3% | 667,780 people |
| Gurung | 2% | 580,678 people |
| Damai/Dholii | 1.8% | 522,610 people |
| Thakuri | 1.6% | 464,543 people |
| Limbu | 1.5% | 435,509 people |
| Sarki | 1.4% | 406,475 people |
| Teli | 1.4% | 406,475 people |
| Chamar/Harijan/Ram | 1.3% | 377,441 people |
| Koiri/Kushwaha | 1.2% | 348,407 people |
| other | 19% | 5,516,444 people |
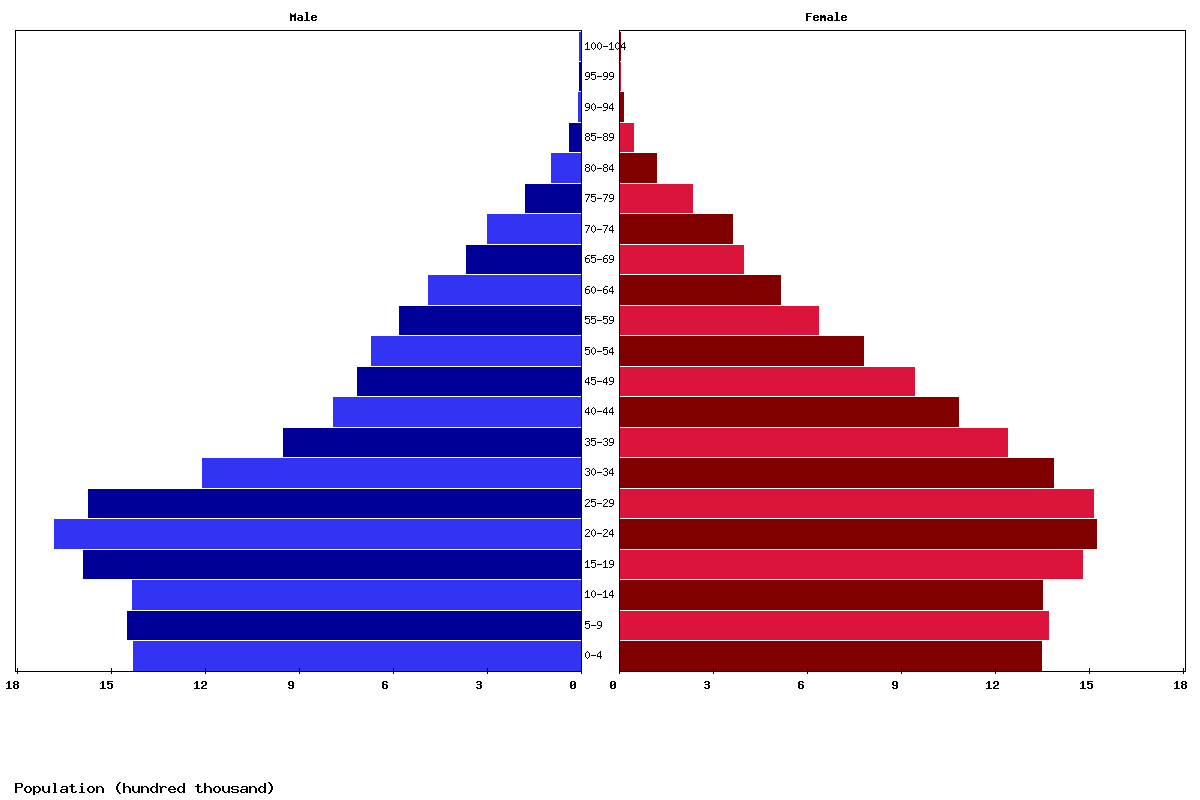
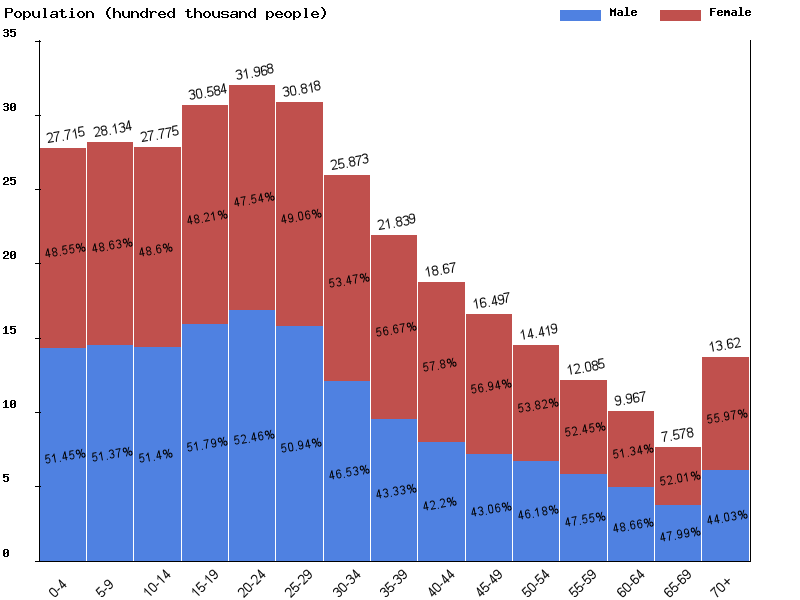
| Age | Both Sexes Population | Male Population | Female Population | Both Sexes (%) | Male (%) | Female (%) | Sex ratio (female/male) |
|---|---|---|---|---|---|---|---|
| Total | 31,754,191 | 15,466,714 | 16,287,477 | 100 | 100 | 100 | 95 |
| 00-04 | 2,771,542 | 1,426,068 | 1,345,474 | 8.7 | 9.2 | 8.3 | 106 |
| 05-09 | 2,813,385 | 1,445,193 | 1,368,192 | 8.9 | 9.3 | 8.4 | 105.6 |
| 10-14 | 2,777,525 | 1,427,679 | 1,349,846 | 8.7 | 9.2 | 8.3 | 105.8 |
| 15-19 | 3,058,384 | 1,583,829 | 1,474,555 | 9.6 | 10.2 | 9.1 | 107.4 |
| 20-24 | 3,196,803 | 1,677,061 | 1,519,742 | 10.1 | 10.8 | 9.3 | 110.4 |
| 25-29 | 3,081,806 | 1,569,819 | 1,511,987 | 9.7 | 10.1 | 9.3 | 103.8 |
| 30-34 | 2,587,313 | 1,203,765 | 1,383,548 | 8.1 | 7.8 | 8.5 | 87 |
| 35-39 | 2,183,923 | 946,230 | 1,237,693 | 6.9 | 6.1 | 7.6 | 76.5 |
| 40-44 | 1,866,953 | 787,828 | 1,079,125 | 5.9 | 5.1 | 6.6 | 73 |
| 45-49 | 1,649,664 | 710,321 | 939,343 | 5.2 | 4.6 | 5.8 | 75.6 |
| 50-54 | 1,441,856 | 665,909 | 775,947 | 4.5 | 4.3 | 4.8 | 85.8 |
| 55-59 | 1,208,515 | 574,708 | 633,807 | 3.8 | 3.7 | 3.9 | 90.7 |
| 60-64 | 996,695 | 484,999 | 511,696 | 3.1 | 3.1 | 3.1 | 94.8 |
| 65-69 | 757,811 | 363,646 | 394,165 | 2.4 | 2.4 | 2.4 | 92.3 |
| 70-74 | 656,011 | 295,542 | 360,469 | 2.1 | 1.9 | 2.2 | 82 |
| 75-79 | 405,753 | 173,524 | 232,229 | 1.3 | 1.1 | 1.4 | 74.7 |
| 80-84 | 206,107 | 90,821 | 115,286 | 0.6 | 0.6 | 0.7 | 78.8 |
| 85-89 | 75,086 | 32,635 | 42,451 | 0.2 | 0.2 | 0.3 | 76.9 |
| 90-94 | 16,634 | 6,364 | 10,270 | 0.1 | 0 | 0.1 | 62 |
| 95-99 | 2,279 | 736 | 1,543 | 0 | 0 | 0 | 47.7 |
| 100+ | 146 | 37 | 109 | 0 | 0 | 0 | 33.9 |
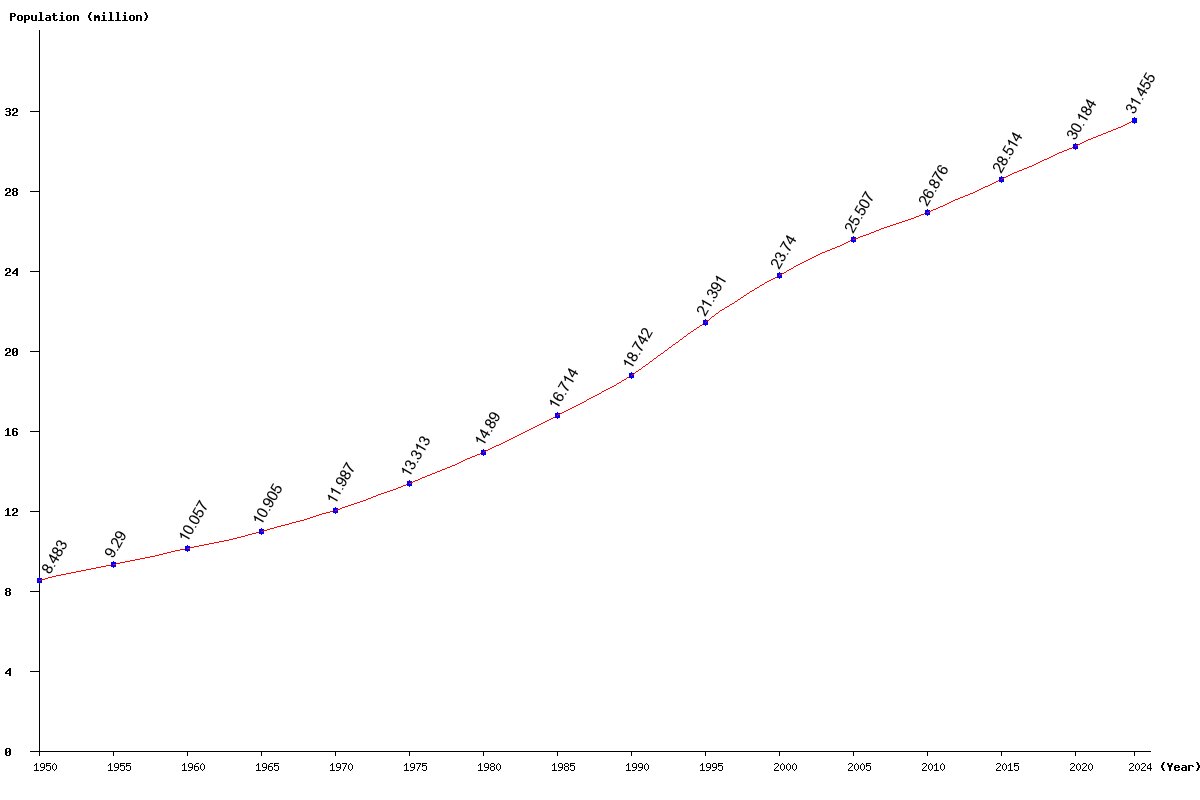
| Year | Population | Yearly % Change |
Yearly Change |
Sex ratio | Density (P/Km²) |
|---|---|---|---|---|---|
| 2025 | 31,754,191 | 0.95 | 299,311 | 94.96 | 221.52 |
| 2024 | 31,454,880 | 0.99 | 307,797 | 94.88 | 219.43 |
| 2023 | 31,147,083 | 1.02 | 315,201 | 94.81 | 217.28 |
| 2022 | 30,831,882 | 1.05 | 321,313 | 94.72 | 215.08 |
| 2021 | 30,510,569 | 1.08 | 326,204 | 94.63 | 212.84 |
| 2020 | 30,184,365 | 1.11 | 329,896 | 94.52 | 210.56 |
| 2019 | 29,854,469 | 1.13 | 332,666 | 94.39 | 208.26 |
| 2018 | 29,521,803 | 1.15 | 334,766 | 94.26 | 205.94 |
| 2017 | 29,187,037 | 1.17 | 336,320 | 94.13 | 203.61 |
| 2016 | 28,850,717 | 1.18 | 337,017 | 94.04 | 201.26 |
| 2015 | 28,513,700 | 1.20 | 338,976 | 94.01 | 198.91 |
| 2014 | 28,174,724 | 1.22 | 339,743 | 94.03 | 196.54 |
| 2013 | 27,834,981 | 1.22 | 334,466 | 94.11 | 194.17 |
| 2012 | 27,500,515 | 1.18 | 321,278 | 94.28 | 191.84 |
| 2011 | 27,179,237 | 1.13 | 303,327 | 94.56 | 189.60 |
| 2010 | 26,875,910 | 1.07 | 283,244 | 94.97 | 187.48 |
| 2005 | 25,506,847 | 7.44 | 1,766,702 | 98.25 | 177.93 |
| 2000 | 23,740,145 | 10.98 | 2,349,240 | 98.92 | 165.61 |
| 1995 | 21,390,905 | 14.14 | 2,649,217 | 101.90 | 149.22 |
| 1990 | 18,741,688 | 12.13 | 2,027,353 | 98.48 | 130.74 |
| 1985 | 16,714,335 | 12.25 | 1,824,255 | 99.76 | 116.60 |
| 1980 | 14,890,080 | 11.84 | 1,576,593 | 100.04 | 103.87 |
| 1975 | 13,313,487 | 11.07 | 1,326,513 | 99.53 | 92.87 |
| 1970 | 11,986,974 | 9.92 | 1,081,968 | 98.84 | 83.62 |
| 1965 | 10,905,006 | 8.43 | 848,061 | 99.09 | 76.07 |
| 1960 | 10,056,945 | 8.25 | 766,771 | 99.21 | 70.16 |
| 1955 | 9,290,174 | 9.51 | 806,853 | 98.40 | 64.81 |
| 1950 | 8,483,321 | 98.20 | 59.18 |