Montenegro population
648,395
Births this year: 64,894
Births today 11
Deaths this year 61,076
Deaths today 11
648,395
| Region Name | Percents | Number |
|---|---|---|
| Orthodox | 72.1% | 464,741 people |
| Muslim | 19.1% | 123,114 people |
| Catholic | 3.4% | 21,916 people |
| atheist | 1.2% | 7,735 people |
| other | 1.5% | 9,669 people |
| unspecified | 2.6% | 16,759 people |
| Ethnic groups Name | Percents | Number |
|---|---|---|
| Montenegrin | 45% | 290,060 people |
| Serbian | 28.7% | 184,994 people |
| Bosniak | 8.7% | 56,078 people |
| Albanian | 4.9% | 31,584 people |
| Muslim | 3.3% | 21,271 people |
| Roma | 1% | 6,446 people |
| Croat | 1% | 6,446 people |
| other | 2.6% | 16,759 people |
| unspecified | 4.9% | 31,584 people |
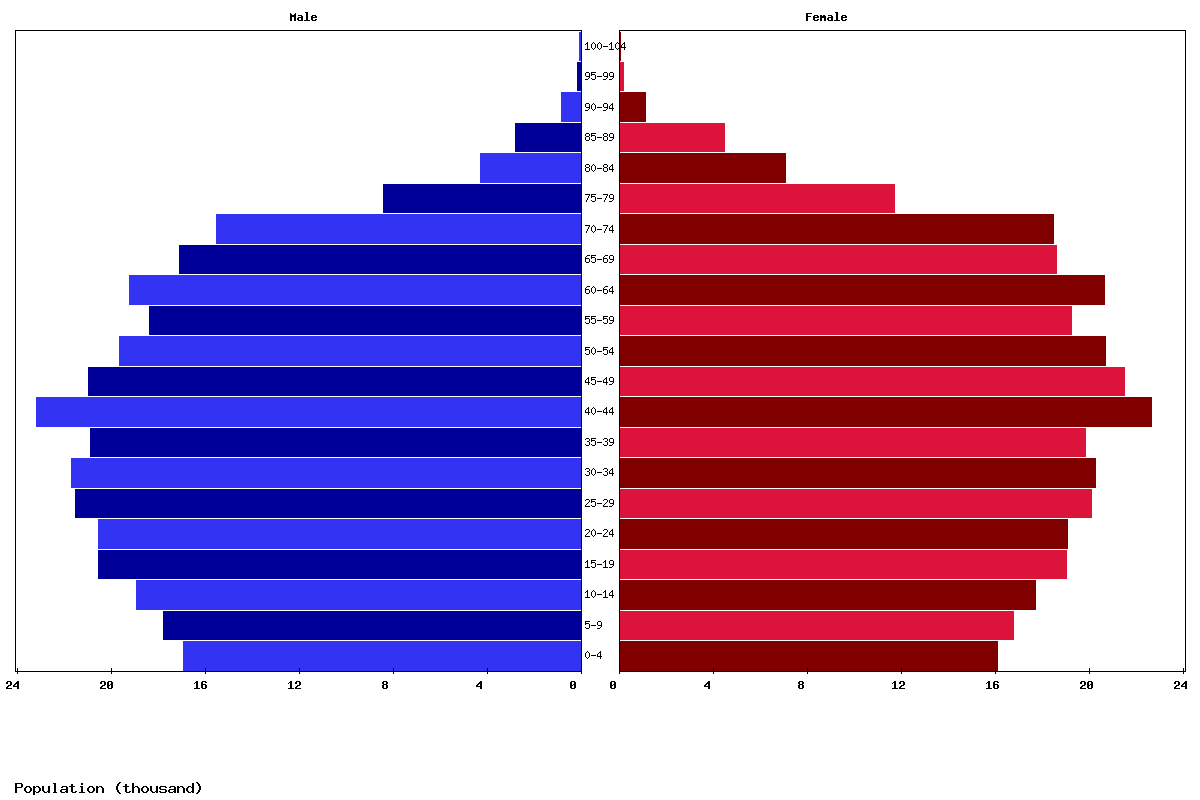
| Age | Both Sexes Population | Male Population | Female Population | Both Sexes (%) | Male (%) | Female (%) | Sex ratio (female/male) |
|---|---|---|---|---|---|---|---|
| Total | 622,924 | 308,201 | 314,723 | 100 | 100 | 100 | 97.9 |
| 00-04 | 32,952 | 16,871 | 16,081 | 5.3 | 5.5 | 5.1 | 104.9 |
| 05-09 | 34,459 | 17,721 | 16,738 | 5.5 | 5.7 | 5.3 | 105.9 |
| 10-14 | 36,570 | 18,890 | 17,680 | 5.9 | 6.1 | 5.6 | 106.8 |
| 15-19 | 39,466 | 20,481 | 18,985 | 6.3 | 6.6 | 6 | 107.9 |
| 20-24 | 39,547 | 20,494 | 19,053 | 6.3 | 6.6 | 6.1 | 107.6 |
| 25-29 | 41,537 | 21,457 | 20,080 | 6.7 | 7 | 6.4 | 106.9 |
| 30-34 | 41,887 | 21,645 | 20,242 | 6.7 | 7 | 6.4 | 106.9 |
| 35-39 | 40,629 | 20,828 | 19,801 | 6.5 | 6.8 | 6.3 | 105.2 |
| 40-44 | 45,732 | 23,115 | 22,617 | 7.3 | 7.5 | 7.2 | 102.2 |
| 45-49 | 42,384 | 20,896 | 21,488 | 6.8 | 6.8 | 6.8 | 97.2 |
| 50-54 | 40,259 | 19,602 | 20,657 | 6.5 | 6.4 | 6.6 | 94.9 |
| 55-59 | 37,559 | 18,327 | 19,232 | 6 | 5.9 | 6.1 | 95.3 |
| 60-64 | 39,780 | 19,172 | 20,608 | 6.4 | 6.2 | 6.5 | 93 |
| 65-69 | 35,616 | 17,038 | 18,578 | 5.7 | 5.5 | 5.9 | 91.7 |
| 70-74 | 33,895 | 15,468 | 18,427 | 5.4 | 5 | 5.9 | 83.9 |
| 75-79 | 20,048 | 8,346 | 11,702 | 3.2 | 2.7 | 3.7 | 71.3 |
| 80-84 | 11,276 | 4,216 | 7,060 | 1.8 | 1.4 | 2.2 | 59.7 |
| 85-89 | 7,173 | 2,732 | 4,441 | 1.2 | 0.9 | 1.4 | 61.5 |
| 90-94 | 1,874 | 770 | 1,104 | 0.3 | 0.2 | 0.4 | 69.7 |
| 95-99 | 264 | 122 | 142 | 0 | 0 | 0 | 85.9 |
| 100+ | 17 | 10 | 7 | 0 | 0 | 0 | 142.9 |

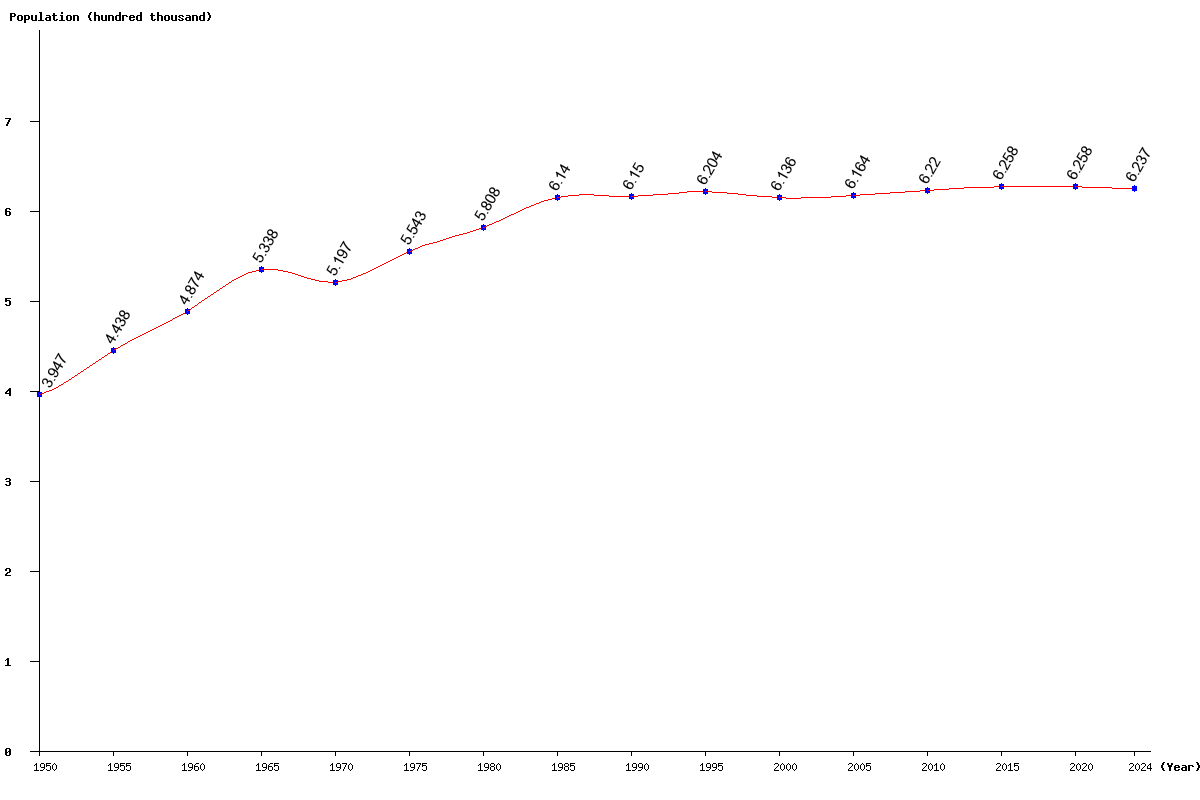
| Year | Population | Yearly % Change |
Yearly Change |
Sex ratio | Density (P/Km²) |
|---|---|---|---|---|---|
| 2025 | 622,924 | -0.12 | -778 | 97.93 | 46.31 |
| 2024 | 623,702 | -0.11 | -687 | 97.91 | 46.37 |
| 2023 | 624,389 | -0.09 | -592 | 97.90 | 46.42 |
| 2022 | 624,981 | -0.08 | -486 | 97.88 | 46.47 |
| 2021 | 625,467 | -0.06 | -371 | 97.86 | 46.50 |
| 2020 | 625,838 | -0.04 | -258 | 97.84 | 46.53 |
| 2019 | 626,096 | -0.02 | -144 | 97.81 | 46.55 |
| 2018 | 626,240 | -0.00 | -10 | 97.78 | 46.56 |
| 2017 | 626,250 | 0.02 | 149 | 97.75 | 46.56 |
| 2016 | 626,101 | 0.05 | 320 | 97.72 | 46.55 |
| 2015 | 625,781 | 0.08 | 489 | 97.68 | 46.53 |
| 2014 | 625,292 | 0.10 | 644 | 97.64 | 46.49 |
| 2013 | 624,648 | 0.13 | 784 | 97.60 | 46.44 |
| 2012 | 623,864 | 0.15 | 907 | 97.55 | 46.38 |
| 2011 | 622,957 | 0.16 | 1,005 | 97.47 | 46.32 |
| 2010 | 621,952 | 0.17 | 1,082 | 97.35 | 46.24 |
| 2005 | 616,389 | 0.46 | 2,832 | 96.61 | 45.83 |
| 2000 | 613,557 | -1.11 | -6,858 | 97.60 | 45.62 |
| 1995 | 620,415 | 0.88 | 5,416 | 98.64 | 46.13 |
| 1990 | 614,999 | 0.16 | 988 | 99.17 | 45.72 |
| 1985 | 614,011 | 5.73 | 33,256 | 97.18 | 45.65 |
| 1980 | 580,755 | 4.78 | 26,493 | 96.35 | 43.18 |
| 1975 | 554,262 | 6.65 | 34,565 | 96.02 | 41.21 |
| 1970 | 519,697 | -2.64 | -14,118 | 95.42 | 38.64 |
| 1965 | 533,815 | 9.52 | 46,399 | 96.50 | 39.69 |
| 1960 | 487,416 | 9.83 | 43,620 | 94.88 | 36.24 |
| 1955 | 443,796 | 12.43 | 49,058 | 93.06 | 33.00 |
| 1950 | 394,738 | 90.78 | 29.35 |