Middle Africa population
0
Births this year: 0
Births today 0
Deaths this year 0
Deaths today 0
0
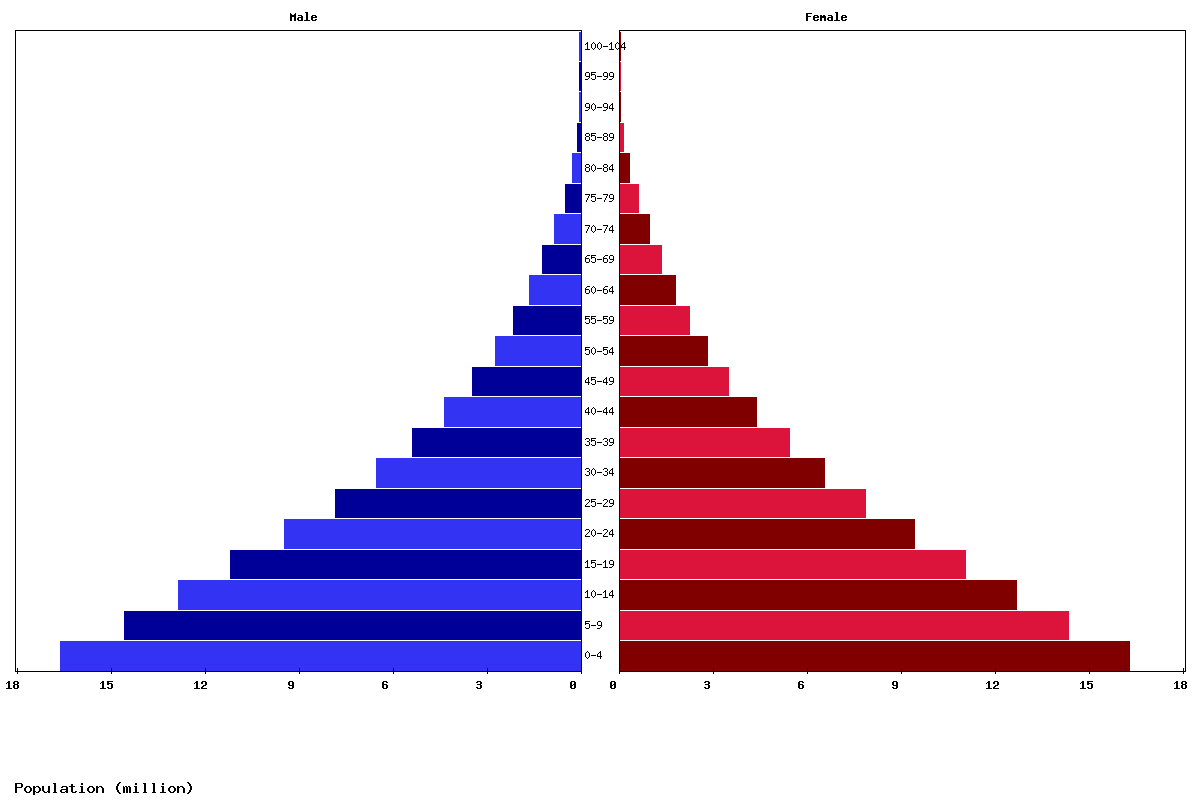
| Age | Both Sexes Population | Male Population | Female Population | Both Sexes (%) | Male (%) | Female (%) | Sex ratio (female/male) |
|---|---|---|---|---|---|---|---|
| Total | 175,950,171 | 87,822,064 | 88,128,107 | 100 | 100 | 100 | 99.7 |
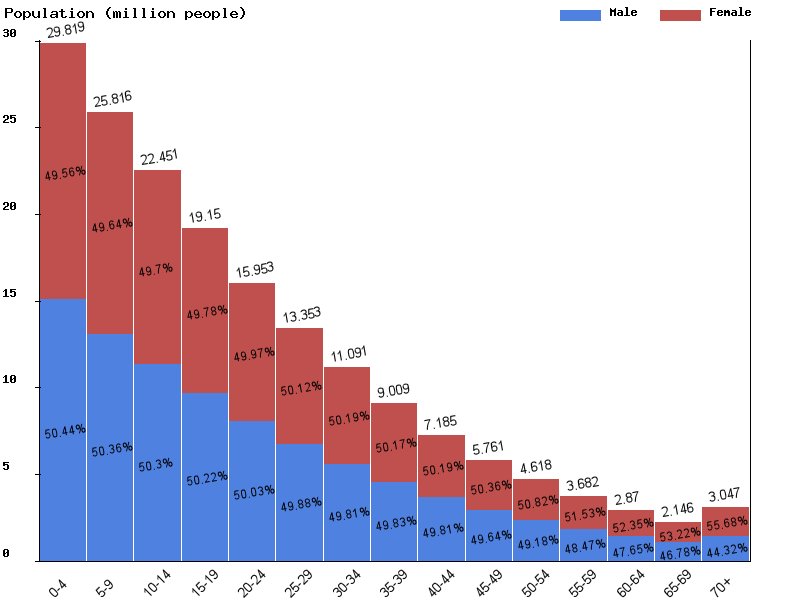
| 00-04 | 29,818,586 | 15,041,435 | 14,777,151 | 16.9 | 17.1 | 16.8 | 101.8 |
| 05-09 | 25,815,920 | 13,000,514 | 12,815,406 | 14.7 | 14.8 | 14.5 | 101.4 |
| 10-14 | 22,450,978 | 11,292,074 | 11,158,904 | 12.8 | 12.9 | 12.7 | 101.2 |
| 15-19 | 19,149,913 | 9,616,463 | 9,533,450 | 10.9 | 10.9 | 10.8 | 100.9 |
| 20-24 | 15,953,276 | 7,981,629 | 7,971,647 | 9.1 | 9.1 | 9 | 100.1 |
| 25-29 | 13,353,252 | 6,660,831 | 6,692,421 | 7.6 | 7.6 | 7.6 | 99.5 |
| 30-34 | 11,090,593 | 5,523,811 | 5,566,782 | 6.3 | 6.3 | 6.3 | 99.2 |
| 35-39 | 9,009,347 | 4,489,594 | 4,519,753 | 5.1 | 5.1 | 5.1 | 99.3 |
| 40-44 | 7,184,686 | 3,578,907 | 3,605,779 | 4.1 | 4.1 | 4.1 | 99.3 |
| 45-49 | 5,761,353 | 2,859,749 | 2,901,604 | 3.3 | 3.3 | 3.3 | 98.6 |
| 50-54 | 4,617,839 | 2,270,894 | 2,346,945 | 2.6 | 2.6 | 2.7 | 96.8 |
| 55-59 | 3,681,510 | 1,784,438 | 1,897,072 | 2.1 | 2 | 2.2 | 94.1 |
| 60-64 | 2,870,087 | 1,367,485 | 1,502,602 | 1.6 | 1.6 | 1.7 | 91 |
| 65-69 | 2,145,712 | 1,003,766 | 1,141,946 | 1.2 | 1.1 | 1.3 | 87.9 |
| 70-74 | 1,478,282 | 675,816 | 802,466 | 0.8 | 0.8 | 0.9 | 84.2 |
| 75-79 | 911,390 | 403,354 | 508,036 | 0.5 | 0.5 | 0.6 | 79.4 |
| 80-84 | 451,410 | 191,440 | 259,970 | 0.3 | 0.2 | 0.3 | 73.6 |
| 85-89 | 162,566 | 64,659 | 97,907 | 0.1 | 0.1 | 0.1 | 66 |
| 90-94 | 37,964 | 13,580 | 24,384 | 0 | 0 | 0 | 55.7 |
| 95-99 | 5,117 | 1,535 | 3,582 | 0 | 0 | 0 | 42.9 |
| 100+ | 390 | 90 | 300 | 0 | 0 | 0 | 30 |
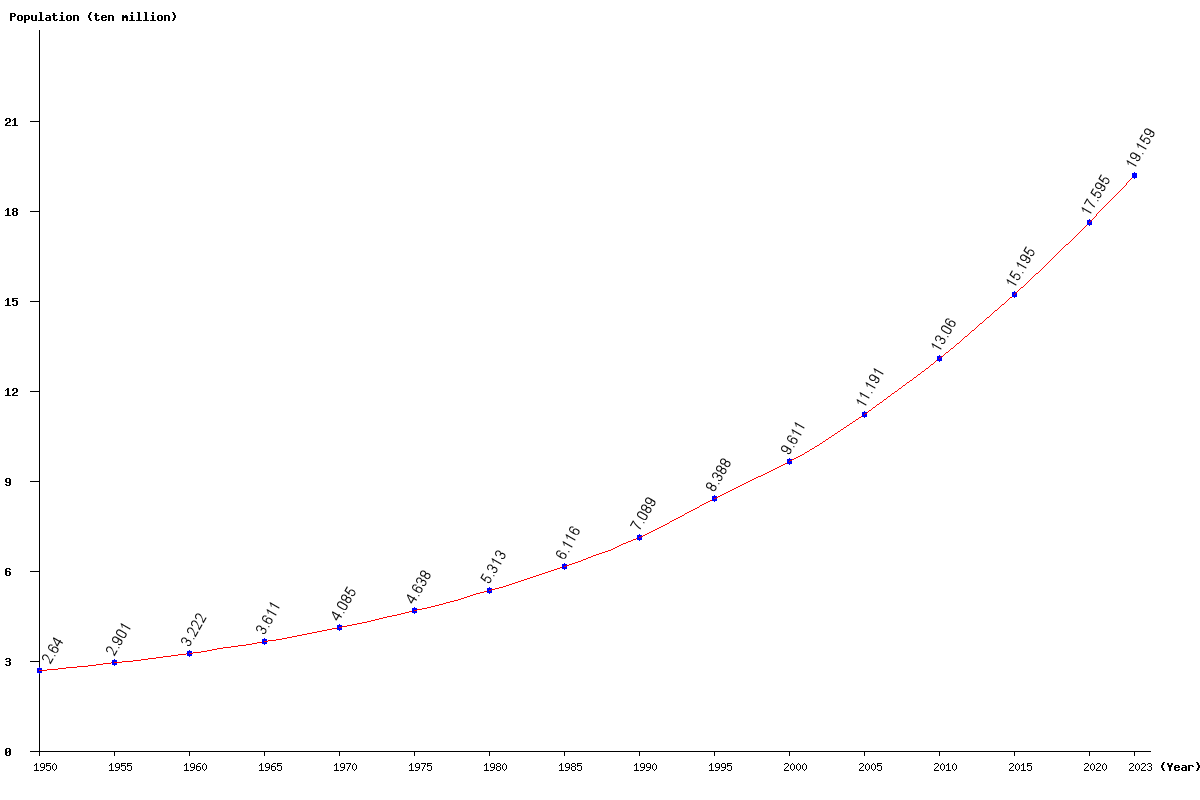
| Year | Population | Yearly % Change |
Yearly Change |
Sex ratio | Density (P/Km²) |
|---|---|---|---|---|---|
| 2023 | 191,592,917 | 2.85 | 5,316,820 | 99.73 | 29.49 |
| 2022 | 186,276,097 | 2.88 | 5,214,337 | 99.71 | 28.67 |
| 2021 | 181,061,760 | 2.91 | 5,111,589 | 99.68 | 27.87 |
| 2020 | 175,950,171 | 2.93 | 5,008,448 | 99.65 | 27.08 |
| 2019 | 170,941,723 | 2.95 | 4,904,737 | 99.62 | 26.31 |
| 2018 | 166,036,986 | 2.98 | 4,800,371 | 99.59 | 25.56 |
| 2017 | 161,236,615 | 3.00 | 4,695,283 | 99.55 | 24.82 |
| 2016 | 156,541,332 | 3.02 | 4,589,593 | 99.52 | 24.10 |
| 2015 | 151,951,739 | 3.04 | 4,482,940 | 99.48 | 23.39 |
| 2014 | 147,468,799 | 3.06 | 4,375,951 | 99.43 | 22.70 |
| 2013 | 143,092,848 | 3.08 | 4,269,713 | 99.38 | 22.03 |
| 2012 | 138,823,135 | 3.09 | 4,164,686 | 99.33 | 21.37 |
| 2011 | 134,658,449 | 3.11 | 4,060,160 | 99.28 | 20.73 |
| 2010 | 130,598,289 | 3.12 | 3,953,975 | 99.22 | 20.10 |
| 2005 | 111,912,892 | 16.44 | 15,799,631 | 98.87 | 17.23 |
| 2000 | 96,113,261 | 14.59 | 12,238,174 | 98.47 | 14.79 |
| 1995 | 83,875,087 | 18.32 | 12,988,654 | 98.08 | 12.91 |
| 1990 | 70,886,433 | 15.90 | 9,722,684 | 97.72 | 10.91 |
| 1985 | 61,163,749 | 15.11 | 8,028,970 | 97.30 | 9.41 |
| 1980 | 53,134,779 | 14.56 | 6,751,765 | 96.68 | 8.18 |
| 1975 | 46,383,014 | 13.56 | 5,537,190 | 96.06 | 7.14 |
| 1970 | 40,845,824 | 13.12 | 4,738,877 | 95.39 | 6.29 |
| 1965 | 36,106,947 | 12.08 | 3,891,253 | 94.73 | 5.56 |
| 1960 | 32,215,694 | 11.04 | 3,203,058 | 94.04 | 4.96 |
| 1955 | 29,012,636 | 9.89 | 2,612,066 | 93.31 | 4.47 |
| 1950 | 26,400,570 | 92.60 | 4.06 |