Micronesia population
121,274
Births this year: 20,874
Births today 0
Deaths this year 4,319
Deaths today 0
121,274
| Region Name | Percents | Number |
|---|---|---|
| Roman Catholic | 54.7% | 57,281 people |
| Protestant (includes Congregational, Baptist, Seventh Day Adventist, Assembly of God) | 41.1% | 43,040 people |
| Mormon | 1.5% | 1,571 people |
| other | 1.9% | 1,990 people |
| none | 0.7% | 733 people |
| unspecified | 0.1% | 105 people |
| Ethnic groups Name | Percents | Number |
|---|---|---|
| Chuukese/Mortlockese | 49.3% | 51,626 people |
| Pohnpeian | 29.8% | 31,206 people |
| Kosraean | 6.3% | 6,597 people |
| Yapese | 5.7% | 5,969 people |
| Yap outer islanders | 5.1% | 5,341 people |
| Polynesian | 1.6% | 1,676 people |
| Asian | 1.4% | 1,466 people |
| other | 0.8% | 838 people |
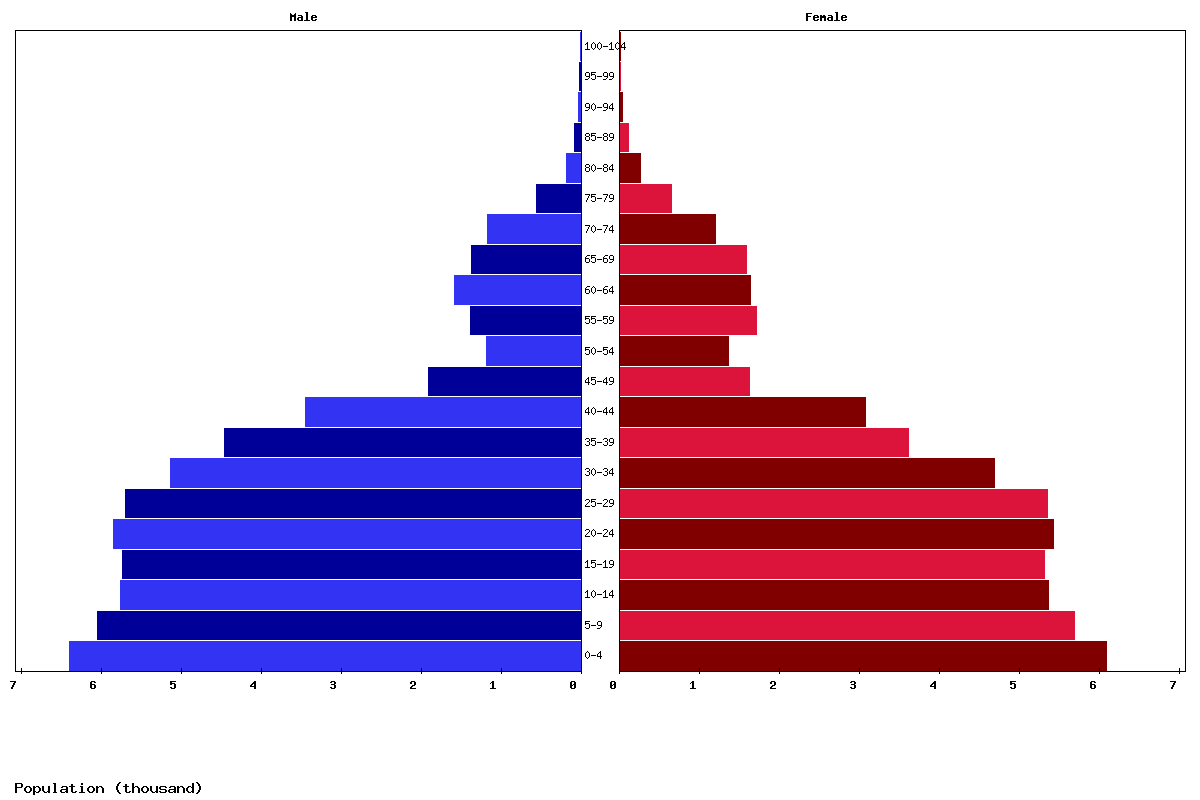
| Age | Both Sexes Population | Male Population | Female Population | Both Sexes (%) | Male (%) | Female (%) | Sex ratio (female/male) |
|---|---|---|---|---|---|---|---|
| Total | 112,374 | 57,691 | 54,683 | 100 | 100 | 100 | 105.5 |
| 00-04 | 12,461 | 6,376 | 6,085 | 11.1 | 11.1 | 11.1 | 104.8 |
| 05-09 | 11,713 | 6,026 | 5,687 | 10.4 | 10.4 | 10.4 | 106 |
| 10-14 | 11,090 | 5,740 | 5,350 | 9.9 | 9.9 | 9.8 | 107.3 |
| 15-19 | 11,032 | 5,722 | 5,310 | 9.8 | 9.9 | 9.7 | 107.8 |
| 20-24 | 11,247 | 5,834 | 5,413 | 10 | 10.1 | 9.9 | 107.8 |
| 25-29 | 11,032 | 5,686 | 5,346 | 9.8 | 9.9 | 9.8 | 106.4 |
| 30-34 | 9,807 | 5,125 | 4,682 | 8.7 | 8.9 | 8.6 | 109.5 |
| 35-39 | 8,044 | 4,442 | 3,602 | 7.2 | 7.7 | 6.6 | 123.3 |
| 40-44 | 6,493 | 3,427 | 3,066 | 5.8 | 5.9 | 5.6 | 111.8 |
| 45-49 | 3,508 | 1,890 | 1,618 | 3.1 | 3.3 | 3 | 116.8 |
| 50-54 | 2,535 | 1,175 | 1,360 | 2.3 | 2 | 2.5 | 86.4 |
| 55-59 | 3,069 | 1,363 | 1,706 | 2.7 | 2.4 | 3.1 | 79.9 |
| 60-64 | 3,205 | 1,574 | 1,631 | 2.9 | 2.7 | 3 | 96.5 |
| 65-69 | 2,933 | 1,352 | 1,581 | 2.6 | 2.3 | 2.9 | 85.5 |
| 70-74 | 2,351 | 1,153 | 1,198 | 2.1 | 2 | 2.2 | 96.2 |
| 75-79 | 1,188 | 547 | 641 | 1.1 | 0.9 | 1.2 | 85.3 |
| 80-84 | 430 | 169 | 261 | 0.4 | 0.3 | 0.5 | 64.8 |
| 85-89 | 170 | 66 | 104 | 0.2 | 0.1 | 0.2 | 63.5 |
| 90-94 | 58 | 22 | 36 | 0.1 | 0 | 0.1 | 61.1 |
| 95-99 | 7 | 2 | 5 | 0 | 0 | 0 | 40 |
| 100+ | 1 | 0 | 1 | 0 | 0 | 0 | 0 |

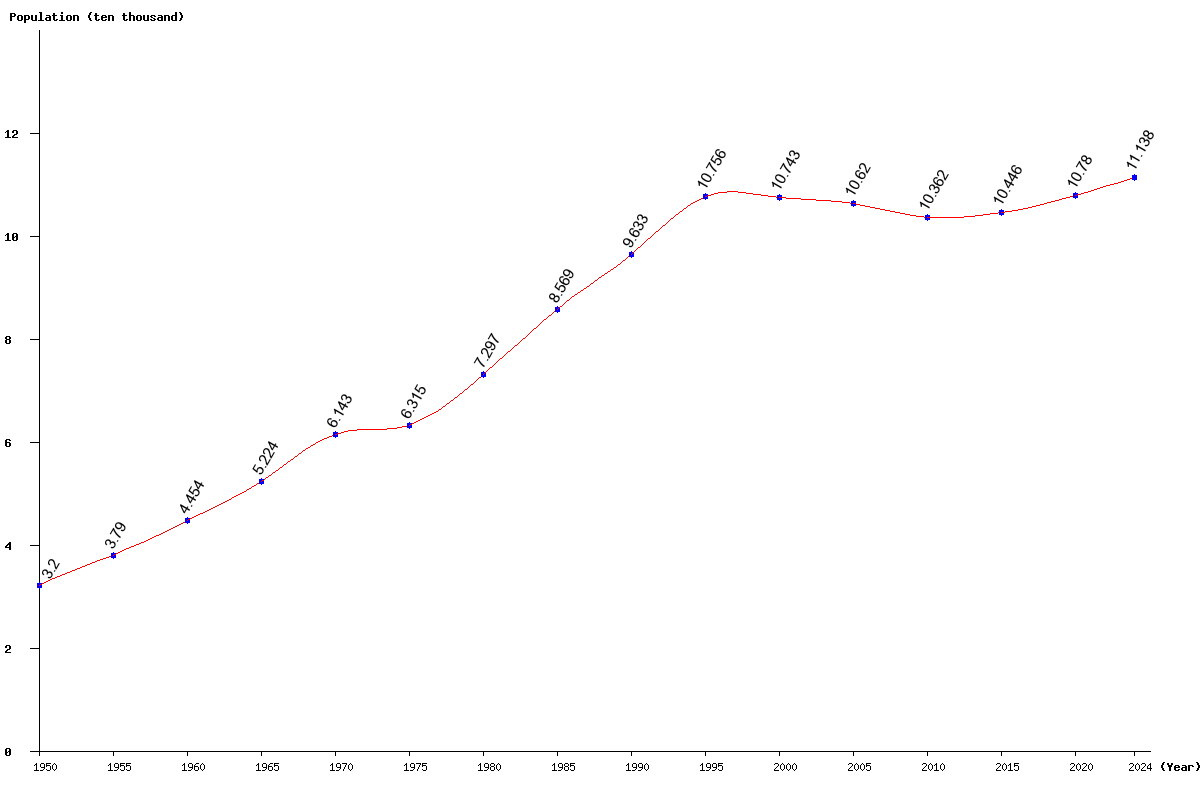
| Year | Population | Yearly % Change |
Yearly Change |
Sex ratio | Density (P/Km²) |
|---|---|---|---|---|---|
| 2025 | 112,374 | 0.90 | 999 | 105.50 | 160.53 |
| 2024 | 111,375 | 0.87 | 956 | 105.49 | 159.11 |
| 2023 | 110,419 | 0.83 | 910 | 105.48 | 157.74 |
| 2022 | 109,509 | 0.81 | 875 | 105.46 | 156.44 |
| 2021 | 108,634 | 0.78 | 839 | 105.43 | 155.19 |
| 2020 | 107,795 | 0.75 | 799 | 105.40 | 153.99 |
| 2019 | 106,996 | 0.70 | 747 | 105.35 | 152.85 |
| 2018 | 106,249 | 0.65 | 683 | 105.29 | 151.78 |
| 2017 | 105,566 | 0.57 | 600 | 105.21 | 150.81 |
| 2016 | 104,966 | 0.48 | 506 | 105.13 | 149.95 |
| 2015 | 104,460 | 0.40 | 416 | 105.02 | 149.23 |
| 2014 | 104,044 | 0.31 | 326 | 104.91 | 148.63 |
| 2013 | 103,718 | 0.20 | 202 | 104.78 | 148.17 |
| 2012 | 103,516 | 0.04 | 40 | 104.63 | 147.88 |
| 2011 | 103,476 | -0.14 | -143 | 104.47 | 147.82 |
| 2010 | 103,619 | -0.33 | -342 | 104.30 | 148.03 |
| 2005 | 106,198 | -1.15 | -1,232 | 103.33 | 151.71 |
| 2000 | 107,430 | -0.12 | -126 | 102.52 | 153.47 |
| 1995 | 107,556 | 11.65 | 11,225 | 104.56 | 153.65 |
| 1990 | 96,331 | 12.42 | 10,642 | 104.71 | 137.62 |
| 1985 | 85,689 | 17.44 | 12,722 | 104.89 | 122.41 |
| 1980 | 72,967 | 15.55 | 9,821 | 104.55 | 104.24 |
| 1975 | 63,146 | 2.79 | 1,713 | 107.02 | 90.21 |
| 1970 | 61,433 | 17.60 | 9,195 | 106.43 | 87.76 |
| 1965 | 52,238 | 17.29 | 7,699 | 106.32 | 74.63 |
| 1960 | 44,539 | 17.53 | 6,643 | 106.22 | 63.63 |
| 1955 | 37,896 | 18.43 | 5,896 | 106.15 | 54.14 |
| 1950 | 32,000 | 106.12 | 45.71 |