Malta population
418,802
Births this year: 40,465
Births today 1
Deaths this year 36,860
Deaths today 1
418,802
| Region Name | Percents | Number |
|---|---|---|
| Roman Catholic (official) more than | 90% | 373,676 people |
| Ethnic groups Name | Percents | Number |
|---|---|---|
| Maltese (descendants of ancient Carthaginians and Phoenicians with strong elements of Italian and other Mediterranean stock) | 100% | 415,196 people |
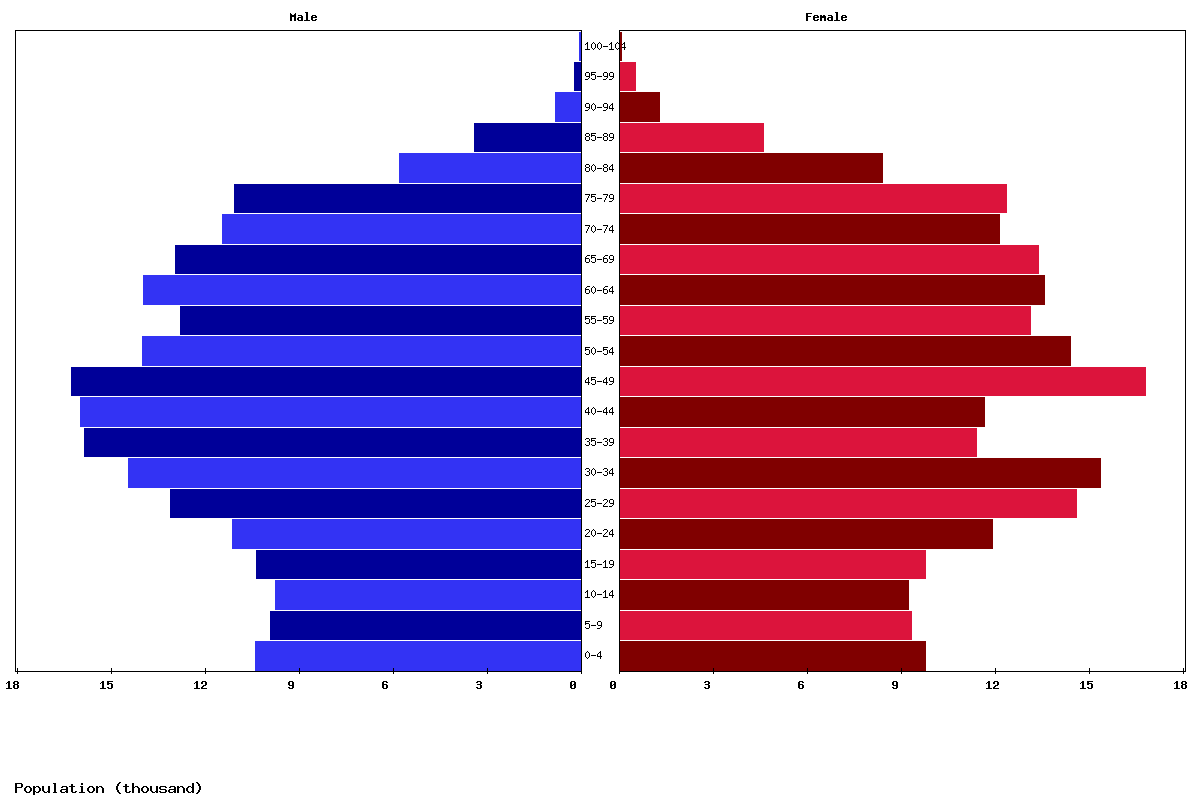
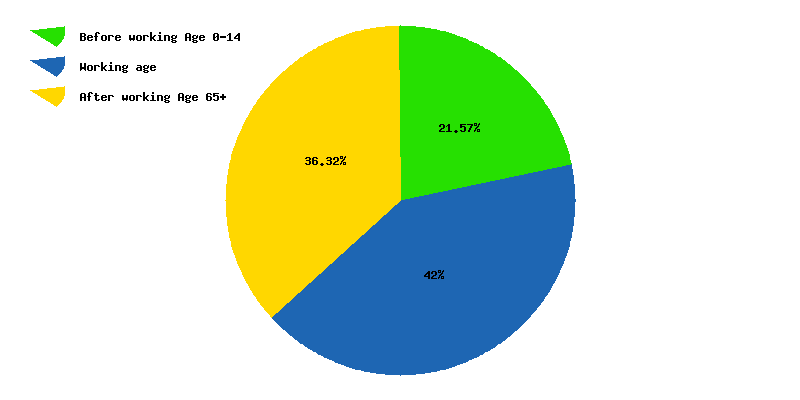
| Age | Both Sexes Population | Male Population | Female Population | Both Sexes (%) | Male (%) | Female (%) | Sex ratio (female/male) |
|---|---|---|---|---|---|---|---|
| Total | 426,103 | 212,943 | 213,160 | 100 | 100 | 100 | 99.9 |
| 00-04 | 20,107 | 10,345 | 9,762 | 4.7 | 4.9 | 4.6 | 106 |
| 05-09 | 19,169 | 9,862 | 9,307 | 4.5 | 4.6 | 4.4 | 106 |
| 10-14 | 18,928 | 9,732 | 9,196 | 4.4 | 4.6 | 4.3 | 105.8 |
| 15-19 | 20,084 | 10,337 | 9,747 | 4.7 | 4.9 | 4.6 | 106.1 |
| 20-24 | 22,971 | 11,087 | 11,884 | 5.4 | 5.2 | 5.6 | 93.3 |
| 25-29 | 27,623 | 13,068 | 14,555 | 6.5 | 6.1 | 6.8 | 89.8 |
| 30-34 | 29,748 | 14,405 | 15,343 | 7 | 6.8 | 7.2 | 93.9 |
| 35-39 | 27,183 | 15,817 | 11,366 | 6.4 | 7.4 | 5.3 | 139.2 |
| 40-44 | 27,589 | 15,953 | 11,636 | 6.5 | 7.5 | 5.5 | 137.1 |
| 45-49 | 33,006 | 16,242 | 16,764 | 7.7 | 7.6 | 7.9 | 96.9 |
| 50-54 | 28,349 | 13,963 | 14,386 | 6.7 | 6.6 | 6.7 | 97.1 |
| 55-59 | 25,831 | 12,745 | 13,086 | 6.1 | 6 | 6.1 | 97.4 |
| 60-64 | 27,497 | 13,939 | 13,558 | 6.5 | 6.5 | 6.4 | 102.8 |
| 65-69 | 26,268 | 12,917 | 13,351 | 6.2 | 6.1 | 6.3 | 96.7 |
| 70-74 | 23,545 | 11,425 | 12,120 | 5.5 | 5.4 | 5.7 | 94.3 |
| 75-79 | 23,377 | 11,034 | 12,343 | 5.5 | 5.2 | 5.8 | 89.4 |
| 80-84 | 14,119 | 5,747 | 8,372 | 3.3 | 2.7 | 3.9 | 68.6 |
| 85-89 | 7,950 | 3,374 | 4,576 | 1.9 | 1.6 | 2.1 | 73.7 |
| 90-94 | 2,036 | 770 | 1,266 | 0.5 | 0.4 | 0.6 | 60.8 |
| 95-99 | 647 | 165 | 482 | 0.2 | 0.1 | 0.2 | 34.2 |
| 100+ | 76 | 16 | 60 | 0 | 0 | 0 | 26.7 |
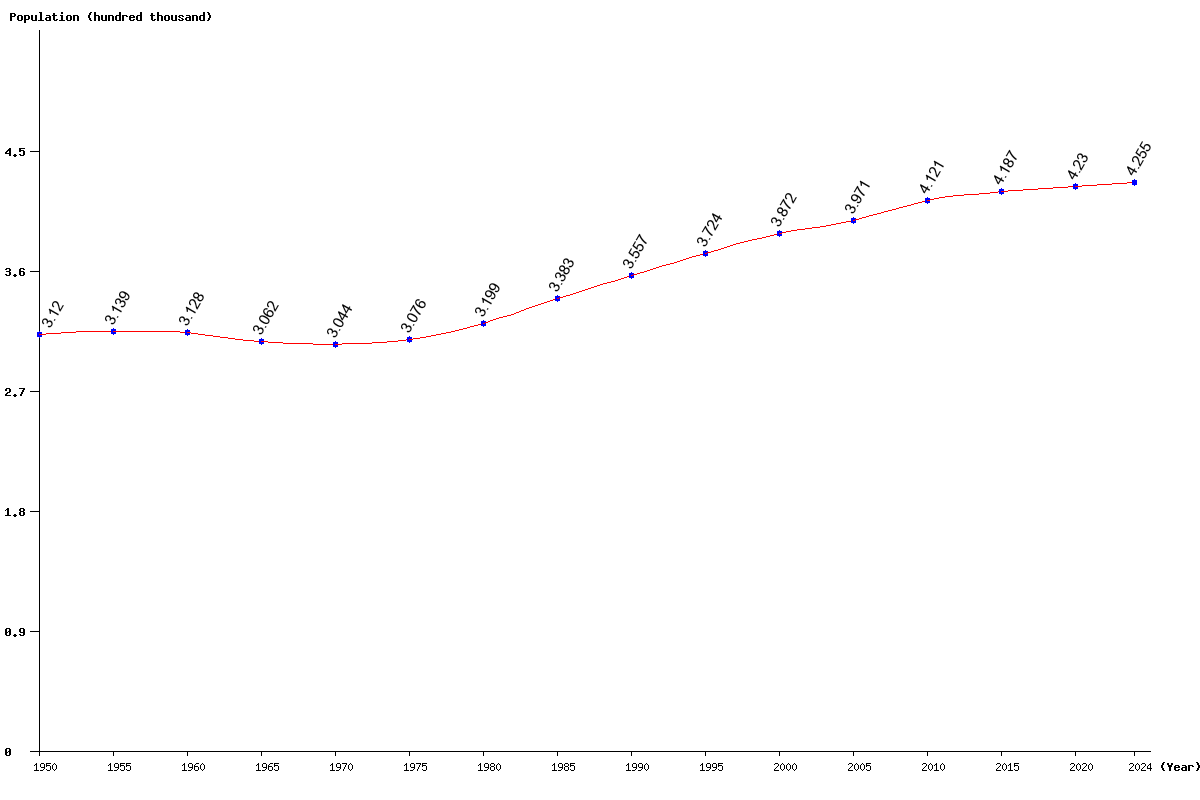
| Year | Population | Yearly % Change |
Yearly Change |
Sex ratio | Density (P/Km²) |
|---|---|---|---|---|---|
| 2025 | 426,103 | 0.13 | 555 | 99.90 | 1,331.57 |
| 2024 | 425,548 | 0.14 | 593 | 99.83 | 1,329.84 |
| 2023 | 424,955 | 0.15 | 627 | 99.77 | 1,327.98 |
| 2022 | 424,328 | 0.16 | 664 | 99.71 | 1,326.03 |
| 2021 | 423,664 | 0.17 | 704 | 99.64 | 1,323.95 |
| 2020 | 422,960 | 0.18 | 757 | 99.58 | 1,321.75 |
| 2019 | 422,203 | 0.19 | 816 | 99.51 | 1,319.38 |
| 2018 | 421,387 | 0.21 | 866 | 99.44 | 1,316.83 |
| 2017 | 420,521 | 0.22 | 906 | 99.36 | 1,314.13 |
| 2016 | 419,615 | 0.23 | 945 | 99.28 | 1,311.30 |
| 2015 | 418,670 | 0.23 | 947 | 99.20 | 1,308.34 |
| 2014 | 417,723 | 0.23 | 976 | 99.12 | 1,305.38 |
| 2013 | 416,747 | 0.28 | 1,151 | 99.04 | 1,302.33 |
| 2012 | 415,596 | 0.37 | 1,521 | 98.95 | 1,298.74 |
| 2011 | 414,075 | 0.49 | 2,011 | 98.84 | 1,293.98 |
| 2010 | 412,064 | 0.63 | 2,589 | 98.70 | 1,287.70 |
| 2005 | 397,094 | 2.56 | 9,914 | 97.80 | 1,240.92 |
| 2000 | 387,180 | 3.97 | 14,789 | 97.89 | 1,209.94 |
| 1995 | 372,391 | 4.69 | 16,684 | 97.33 | 1,163.72 |
| 1990 | 355,707 | 5.13 | 17,359 | 96.57 | 1,111.58 |
| 1985 | 338,348 | 5.77 | 18,450 | 95.82 | 1,057.34 |
| 1980 | 319,898 | 4.00 | 12,301 | 94.44 | 999.68 |
| 1975 | 307,597 | 1.05 | 3,183 | 93.97 | 961.24 |
| 1970 | 304,414 | -0.59 | -1,798 | 93.65 | 951.29 |
| 1965 | 306,212 | -2.10 | -6,576 | 93.32 | 956.91 |
| 1960 | 312,788 | -0.36 | -1,126 | 93.74 | 977.46 |
| 1955 | 313,914 | 0.61 | 1,917 | 93.50 | 980.98 |
| 1950 | 311,997 | 97.47 | 974.99 |