Lithuania population
2,729,100
Births this year: 278,078
Births today 5
Deaths this year 403,214
Deaths today 8
2,729,100
| Region Name | Percents | Number |
|---|---|---|
| Roman Catholic | 77.2% | 2,203,469 people |
| Russian Orthodox | 4.1% | 117,024 people |
| Old Believer | 0.8% | 22,834 people |
| Evangelical Lutheran | 0.6% | 17,125 people |
| Evangelical Reformist | 0.2% | 5,708 people |
| other (including Sunni Muslim, Jewish, Greek Catholic, and Karaite) | 0.8% | 22,834 people |
| none | 6.1% | 174,108 people |
| unspecified | 10.1% | 288,278 people |
| Ethnic groups Name | Percents | Number |
|---|---|---|
| Lithuanian | 84.1% | 2,400,412 people |
| Polish | 6.6% | 188,380 people |
| Russian | 5.8% | 165,546 people |
| Belarusian | 1.2% | 34,251 people |
| other | 1.1% | 31,397 people |
| unspecified | 1.2% | 34,251 people |
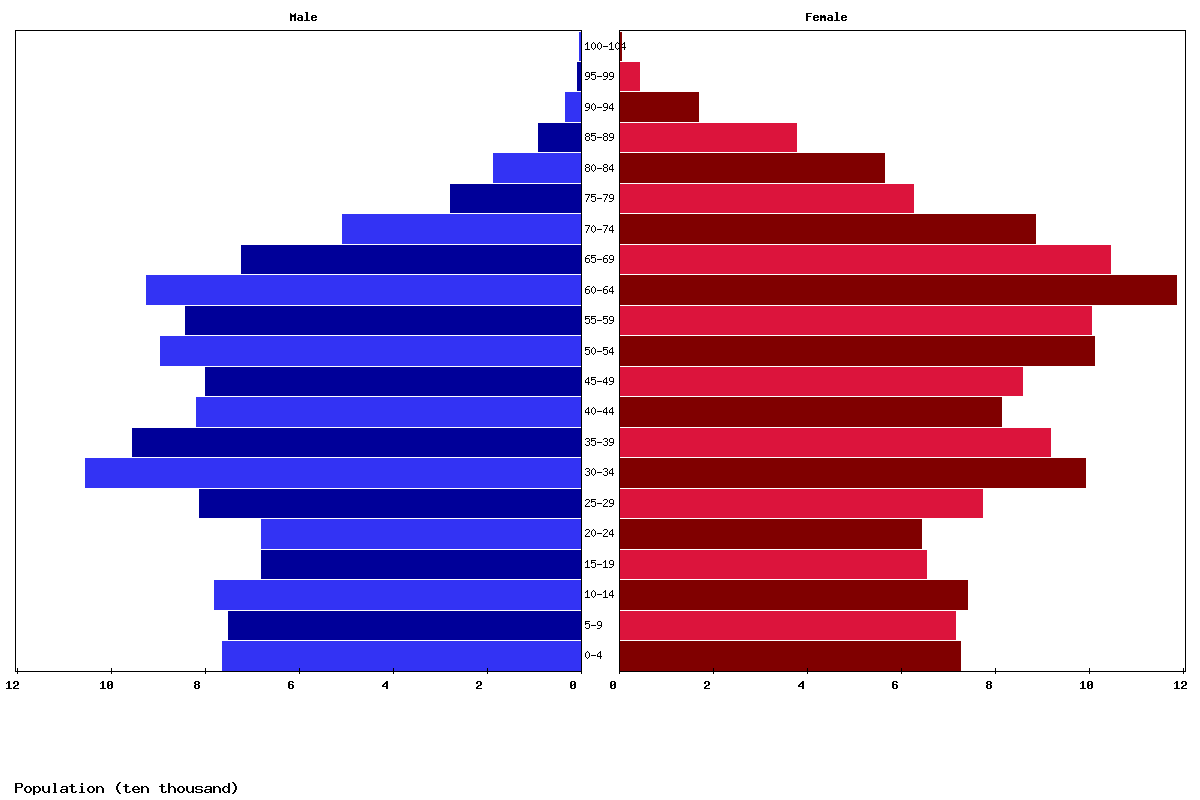
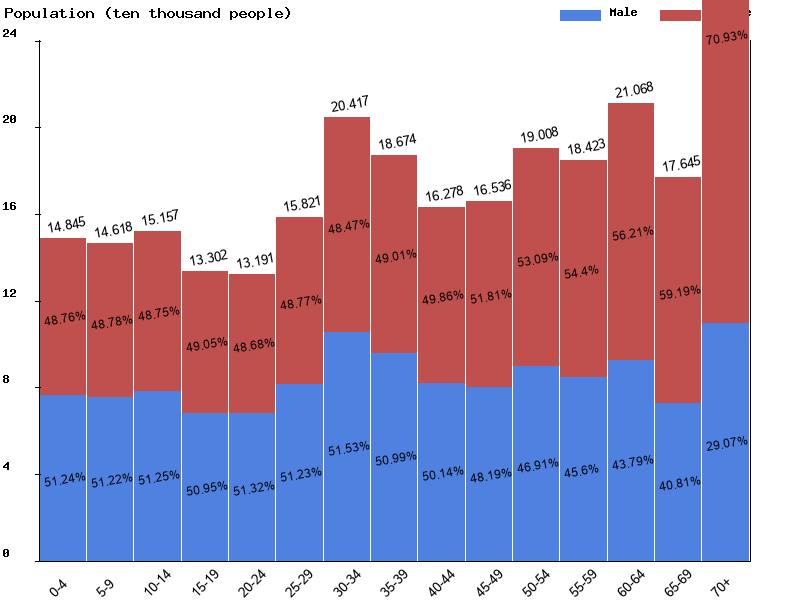
| Age | Both Sexes Population | Male Population | Female Population | Both Sexes (%) | Male (%) | Female (%) | Sex ratio (female/male) |
|---|---|---|---|---|---|---|---|
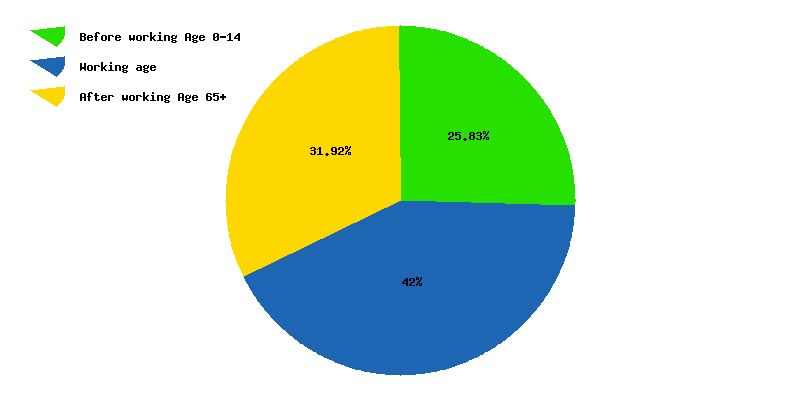
| Total | 2,724,613 | 1,253,254 | 1,471,359 | 100 | 100 | 100 | 85.2 |
| 00-04 | 148,449 | 76,063 | 72,386 | 5.4 | 6.1 | 4.9 | 105.1 |
| 05-09 | 146,178 | 74,878 | 71,300 | 5.4 | 6 | 4.8 | 105 |
| 10-14 | 151,574 | 77,687 | 73,887 | 5.6 | 6.2 | 5 | 105.1 |
| 15-19 | 133,019 | 67,773 | 65,246 | 4.9 | 5.4 | 4.4 | 103.9 |
| 20-24 | 131,909 | 67,692 | 64,217 | 4.8 | 5.4 | 4.4 | 105.4 |
| 25-29 | 158,205 | 81,044 | 77,161 | 5.8 | 6.5 | 5.2 | 105 |
| 30-34 | 204,168 | 105,213 | 98,955 | 7.5 | 8.4 | 6.7 | 106.3 |
| 35-39 | 186,739 | 95,218 | 91,521 | 6.9 | 7.6 | 6.2 | 104 |
| 40-44 | 162,782 | 81,617 | 81,165 | 6 | 6.5 | 5.5 | 100.6 |
| 45-49 | 165,358 | 79,679 | 85,679 | 6.1 | 6.4 | 5.8 | 93 |
| 50-54 | 190,079 | 89,175 | 100,904 | 7 | 7.1 | 6.9 | 88.4 |
| 55-59 | 184,225 | 84,008 | 100,217 | 6.8 | 6.7 | 6.8 | 83.8 |
| 60-64 | 210,678 | 92,260 | 118,418 | 7.7 | 7.4 | 8 | 77.9 |
| 65-69 | 176,450 | 72,004 | 104,446 | 6.5 | 5.7 | 7.1 | 68.9 |
| 70-74 | 138,916 | 50,582 | 88,334 | 5.1 | 4 | 6 | 57.3 |
| 75-79 | 90,019 | 27,560 | 62,459 | 3.3 | 2.2 | 4.2 | 44.1 |
| 80-84 | 74,787 | 18,444 | 56,343 | 2.7 | 1.5 | 3.8 | 32.7 |
| 85-89 | 46,237 | 8,728 | 37,509 | 1.7 | 0.7 | 2.5 | 23.3 |
| 90-94 | 19,868 | 3,176 | 16,692 | 0.7 | 0.3 | 1.1 | 19 |
| 95-99 | 4,534 | 426 | 4,108 | 0.2 | 0 | 0.3 | 10.4 |
| 100+ | 439 | 27 | 412 | 0 | 0 | 0 | 6.6 |
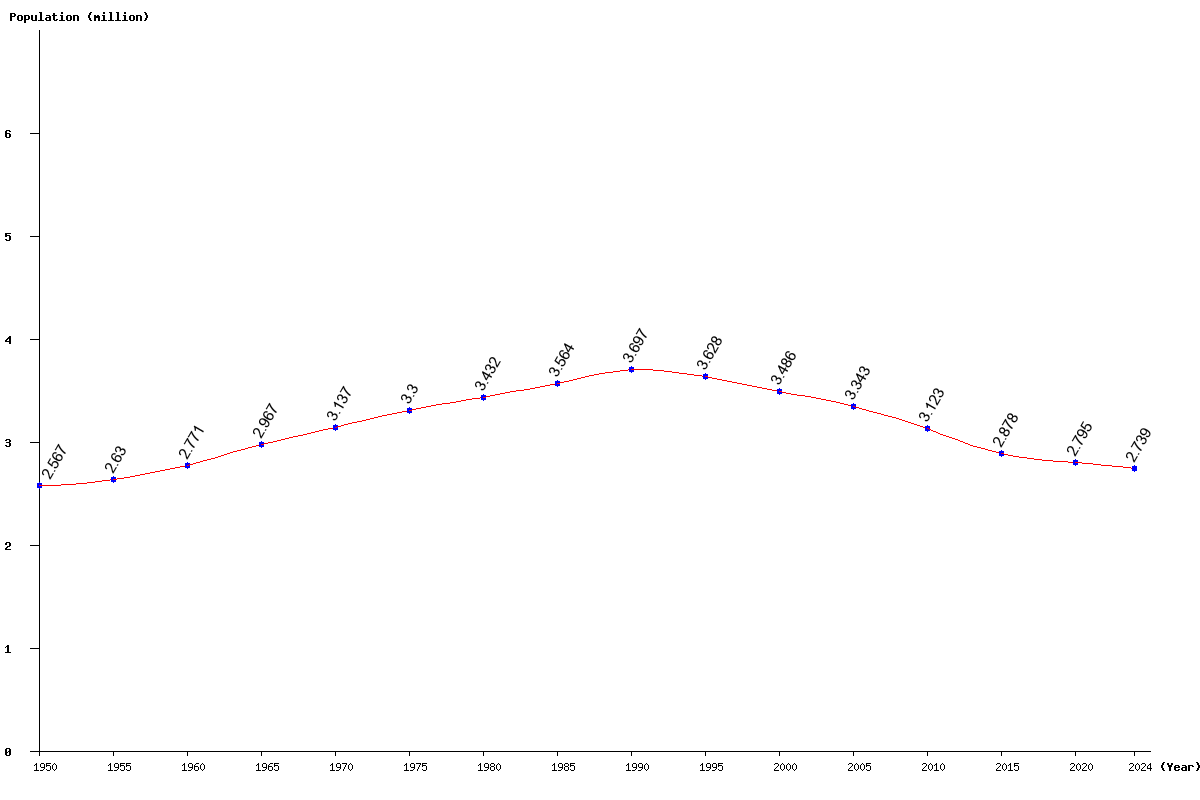
| Year | Population | Yearly % Change |
Yearly Change |
Sex ratio | Density (P/Km²) |
|---|---|---|---|---|---|
| 2025 | 2,724,613 | -0.51 | -14,039 | 85.18 | 43.47 |
| 2024 | 2,738,652 | -0.53 | -14,551 | 85.11 | 43.70 |
| 2023 | 2,753,203 | -0.53 | -14,602 | 85.05 | 43.93 |
| 2022 | 2,767,805 | -0.50 | -13,977 | 85.00 | 44.16 |
| 2021 | 2,781,782 | -0.47 | -13,116 | 84.97 | 44.38 |
| 2020 | 2,794,898 | -0.41 | -11,601 | 84.97 | 44.59 |
| 2019 | 2,806,499 | -0.39 | -10,903 | 85.02 | 44.78 |
| 2018 | 2,817,402 | -0.47 | -13,180 | 85.09 | 44.95 |
| 2017 | 2,830,582 | -0.68 | -19,448 | 85.18 | 45.16 |
| 2016 | 2,850,030 | -0.99 | -28,375 | 85.26 | 45.47 |
| 2015 | 2,878,405 | -1.32 | -38,393 | 85.33 | 45.93 |
| 2014 | 2,916,798 | -1.59 | -47,012 | 85.35 | 46.54 |
| 2013 | 2,963,810 | -1.75 | -52,686 | 85.35 | 47.29 |
| 2012 | 3,016,496 | -1.76 | -54,097 | 85.37 | 48.13 |
| 2011 | 3,070,593 | -1.67 | -52,242 | 85.43 | 48.99 |
| 2010 | 3,122,835 | -1.56 | -49,601 | 85.57 | 49.83 |
| 2005 | 3,343,268 | -4.10 | -143,105 | 87.03 | 53.34 |
| 2000 | 3,486,373 | -3.91 | -141,706 | 87.97 | 55.63 |
| 1995 | 3,628,079 | -1.87 | -69,314 | 89.11 | 57.89 |
| 1990 | 3,697,393 | 3.75 | 133,652 | 89.83 | 58.99 |
| 1985 | 3,563,741 | 3.84 | 131,808 | 89.46 | 56.86 |
| 1980 | 3,431,933 | 4.00 | 132,114 | 89.17 | 54.76 |
| 1975 | 3,299,819 | 5.18 | 162,446 | 88.92 | 52.65 |
| 1970 | 3,137,373 | 5.74 | 170,426 | 88.35 | 50.06 |
| 1965 | 2,966,947 | 7.08 | 196,210 | 87.23 | 47.34 |
| 1960 | 2,770,737 | 5.37 | 141,166 | 85.53 | 44.21 |
| 1955 | 2,629,571 | 2.42 | 62,169 | 83.97 | 41.96 |
| 1950 | 2,567,402 | 82.16 | 40.96 |