Jamaica population
3,304,789
Births this year: 532,750
Births today 140
Deaths this year 198,302
Deaths today 52
3,304,789
| Region Name | Percents | Number |
|---|---|---|
| Protestant (includes Seventh Day Adventist, Pentecostal, Other Church of God, New Testament Church of God, Baptist, Church of God in Jamaica, Church of God of Prophecy, Anglican, United Church, Methodist, Revived, Brethren, and Moravian) | 64.8% | 1,924,780 people |
| Roman Catholic | 2.2% | 65,347 people |
| other | 33% | 980,212 people |
| Ethnic groups Name | Percents | Number |
|---|---|---|
| black | 92.1% | 2,735,683 people |
| mixed | 6.1% | 181,191 people |
| East Indian | 0.8% | 23,763 people |
| other | 0.4% | 11,881 people |
| unspecified | 0.7% | 20,792 people |
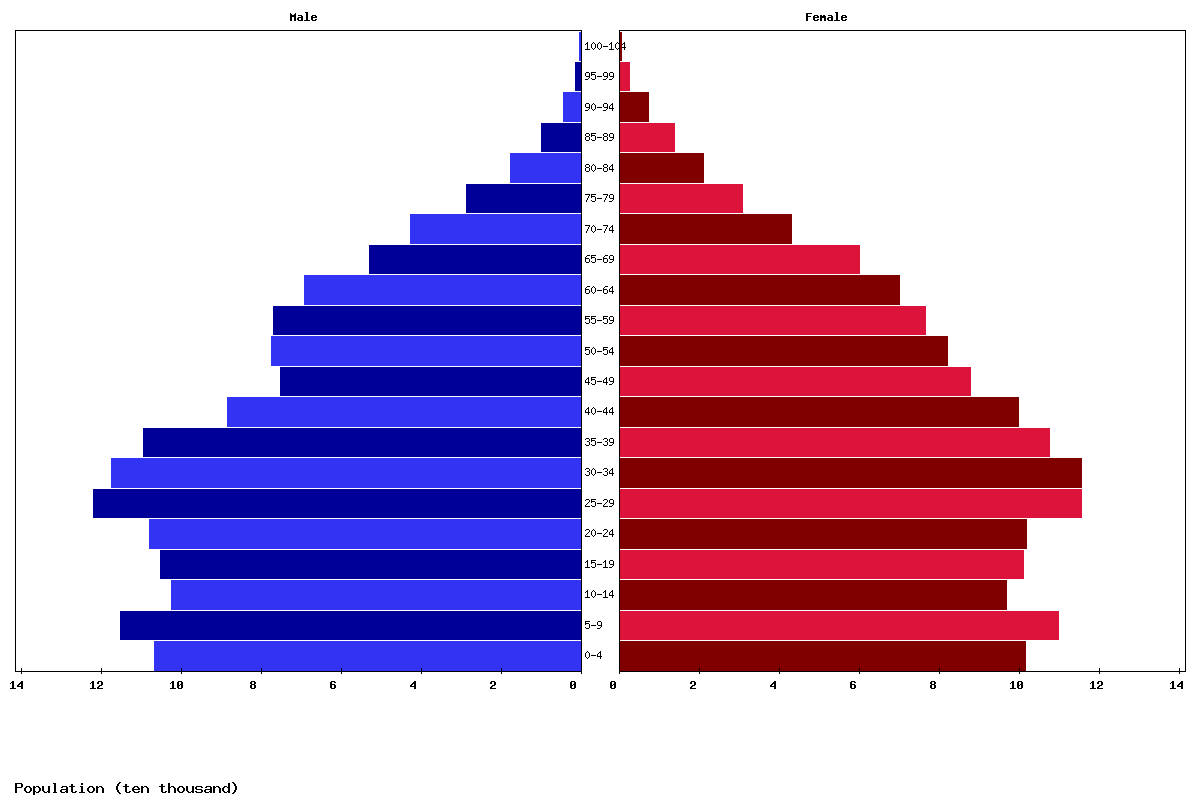
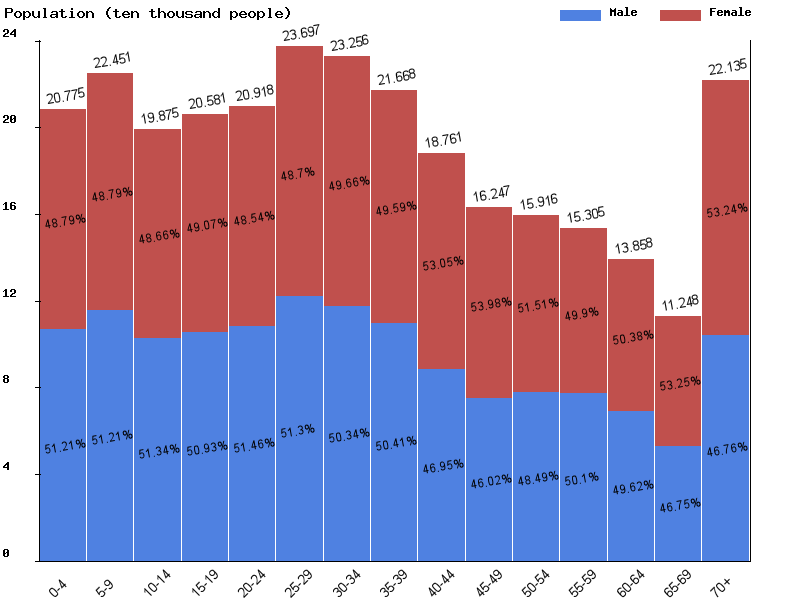
| Age | Both Sexes Population | Male Population | Female Population | Both Sexes (%) | Male (%) | Female (%) | Sex ratio (female/male) |
|---|---|---|---|---|---|---|---|
| Total | 2,866,922 | 1,425,273 | 1,441,649 | 100 | 100 | 100 | 98.9 |
| 00-04 | 207,750 | 106,388 | 101,362 | 7.2 | 7.5 | 7 | 105 |
| 05-09 | 224,511 | 114,966 | 109,545 | 7.8 | 8.1 | 7.6 | 104.9 |
| 10-14 | 198,749 | 102,046 | 96,703 | 6.9 | 7.2 | 6.7 | 105.5 |
| 15-19 | 205,810 | 104,818 | 100,992 | 7.2 | 7.4 | 7 | 103.8 |
| 20-24 | 209,179 | 107,653 | 101,526 | 7.3 | 7.6 | 7 | 106 |
| 25-29 | 236,973 | 121,561 | 115,412 | 8.3 | 8.5 | 8 | 105.3 |
| 30-34 | 232,559 | 117,068 | 115,491 | 8.1 | 8.2 | 8 | 101.4 |
| 35-39 | 216,679 | 109,218 | 107,461 | 7.6 | 7.7 | 7.5 | 101.6 |
| 40-44 | 187,613 | 88,088 | 99,525 | 6.5 | 6.2 | 6.9 | 88.5 |
| 45-49 | 162,468 | 74,761 | 87,707 | 5.7 | 5.2 | 6.1 | 85.2 |
| 50-54 | 159,163 | 77,175 | 81,988 | 5.6 | 5.4 | 5.7 | 94.1 |
| 55-59 | 153,054 | 76,674 | 76,380 | 5.3 | 5.4 | 5.3 | 100.4 |
| 60-64 | 138,578 | 68,756 | 69,822 | 4.8 | 4.8 | 4.8 | 98.5 |
| 65-69 | 112,484 | 52,587 | 59,897 | 3.9 | 3.7 | 4.2 | 87.8 |
| 70-74 | 85,149 | 42,325 | 42,824 | 3 | 3 | 3 | 98.8 |
| 75-79 | 58,954 | 28,412 | 30,542 | 2.1 | 2 | 2.1 | 93 |
| 80-84 | 38,176 | 17,412 | 20,764 | 1.3 | 1.2 | 1.4 | 83.9 |
| 85-89 | 23,262 | 9,704 | 13,558 | 0.8 | 0.7 | 0.9 | 71.6 |
| 90-94 | 11,444 | 4,214 | 7,230 | 0.4 | 0.3 | 0.5 | 58.3 |
| 95-99 | 3,673 | 1,246 | 2,427 | 0.1 | 0.1 | 0.2 | 51.3 |
| 100+ | 694 | 201 | 493 | 0 | 0 | 0 | 40.8 |
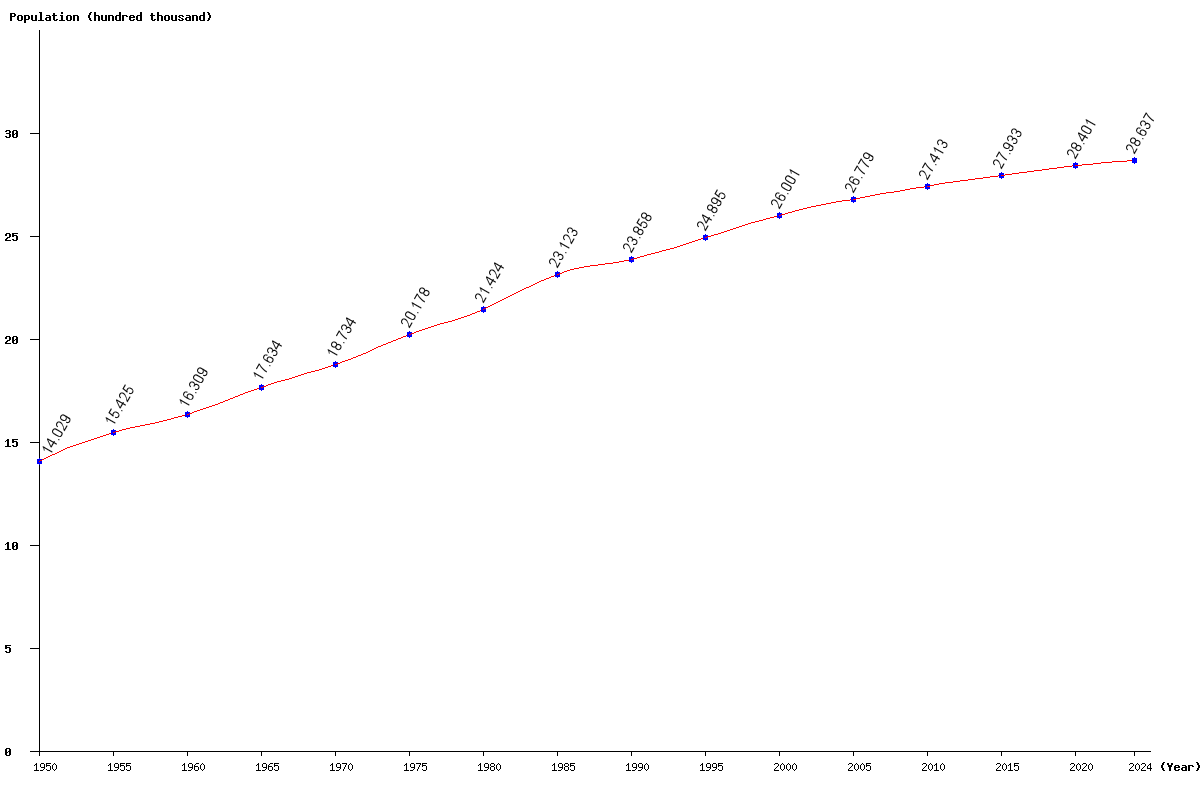
| Year | Population | Yearly % Change |
Yearly Change |
Sex ratio | Density (P/Km²) |
|---|---|---|---|---|---|
| 2025 | 2,866,922 | 0.11 | 3,228 | 98.86 | 264.72 |
| 2024 | 2,863,694 | 0.15 | 4,374 | 98.92 | 264.42 |
| 2023 | 2,859,320 | 0.19 | 5,457 | 98.96 | 264.02 |
| 2022 | 2,853,863 | 0.23 | 6,436 | 98.99 | 263.51 |
| 2021 | 2,847,427 | 0.26 | 7,317 | 99.02 | 262.92 |
| 2020 | 2,840,110 | 0.29 | 8,195 | 99.06 | 262.24 |
| 2019 | 2,831,915 | 0.32 | 9,018 | 99.10 | 261.49 |
| 2018 | 2,822,897 | 0.34 | 9,612 | 99.14 | 260.66 |
| 2017 | 2,813,285 | 0.35 | 9,923 | 99.18 | 259.77 |
| 2016 | 2,803,362 | 0.36 | 10,027 | 99.20 | 258.85 |
| 2015 | 2,793,335 | 0.36 | 10,034 | 99.20 | 257.93 |
| 2014 | 2,783,301 | 0.36 | 10,086 | 99.16 | 257.00 |
| 2013 | 2,773,215 | 0.37 | 10,250 | 99.11 | 256.07 |
| 2012 | 2,762,965 | 0.39 | 10,607 | 99.03 | 255.12 |
| 2011 | 2,752,358 | 0.41 | 11,105 | 98.92 | 254.14 |
| 2010 | 2,741,253 | 0.43 | 11,678 | 98.78 | 253.12 |
| 2005 | 2,677,888 | 2.99 | 77,793 | 98.06 | 247.27 |
| 2000 | 2,600,095 | 4.44 | 110,555 | 98.92 | 240.08 |
| 1995 | 2,489,540 | 4.35 | 103,734 | 97.88 | 229.87 |
| 1990 | 2,385,806 | 3.18 | 73,469 | 97.32 | 220.30 |
| 1985 | 2,312,337 | 7.93 | 169,899 | 98.97 | 213.51 |
| 1980 | 2,142,438 | 6.18 | 124,608 | 97.91 | 197.82 |
| 1975 | 2,017,830 | 7.71 | 144,477 | 96.20 | 186.32 |
| 1970 | 1,873,353 | 6.23 | 109,917 | 95.73 | 172.98 |
| 1965 | 1,763,436 | 8.13 | 132,522 | 91.79 | 162.83 |
| 1960 | 1,630,914 | 5.73 | 88,391 | 92.75 | 150.59 |
| 1955 | 1,542,523 | 9.95 | 139,627 | 94.82 | 142.43 |
| 1950 | 1,402,896 | 94.74 | 129.54 |