Iran population
92,659,905
Births this year: 14,745,987
Births today 3,258
Deaths this year 4,887,715
Deaths today 1,080
92,659,905
| Region Name | Percents | Number |
|---|---|---|
| Muslim (official) | 99.4% | 82,304,823 people |
| other (includes Zoroastrian, Jewish, and Christian) | 0.3% | 248,405 people |
| unspecified | 0.4% | 331,207 people |
| Ethnic groups Name | Percents | Number |
|---|---|---|
| Persian | 61% | 50,508,996 people |
| Azeri | 16% | 13,248,261 people |
| Kurd | 10% | 8,280,163 people |
| Lur | 6% | 4,968,098 people |
| Baloch | 2% | 1,656,033 people |
| Arab | 2% | 1,656,033 people |
| Turkmen and Turkic tribes | 2% | 1,656,033 people |
| other | 1% | 828,016 people |
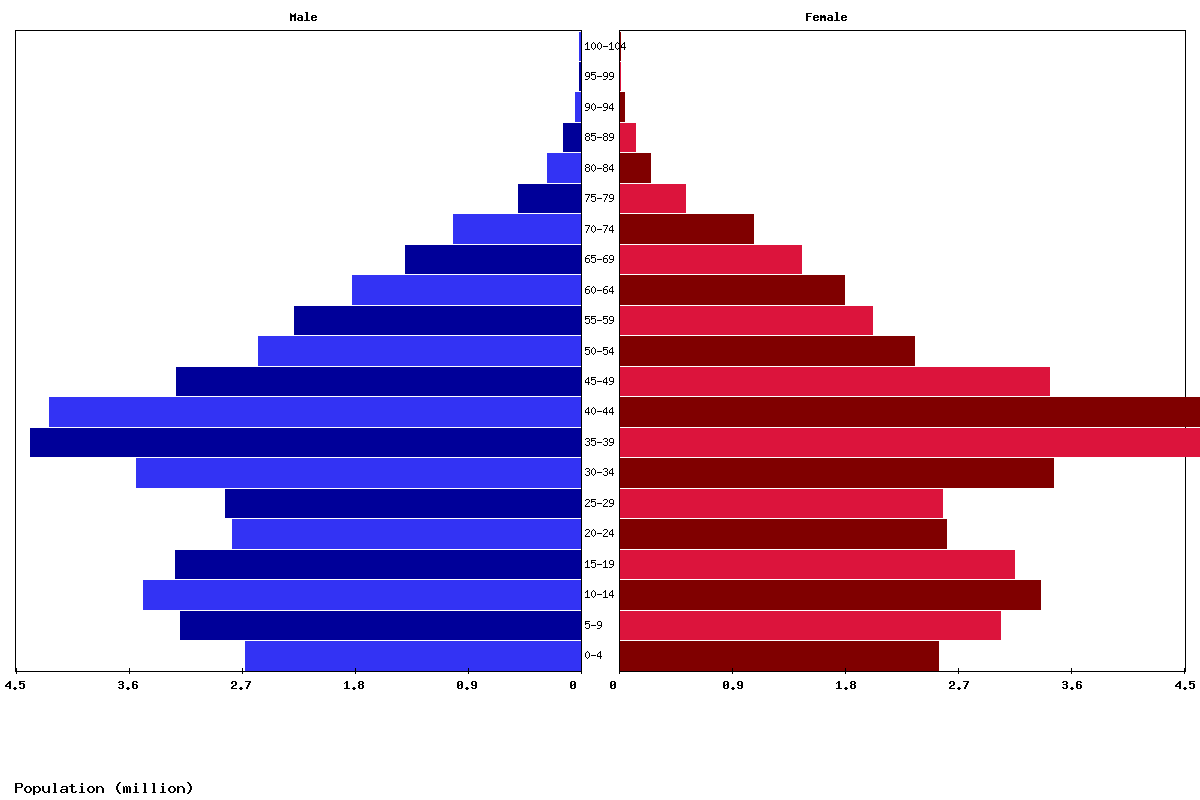
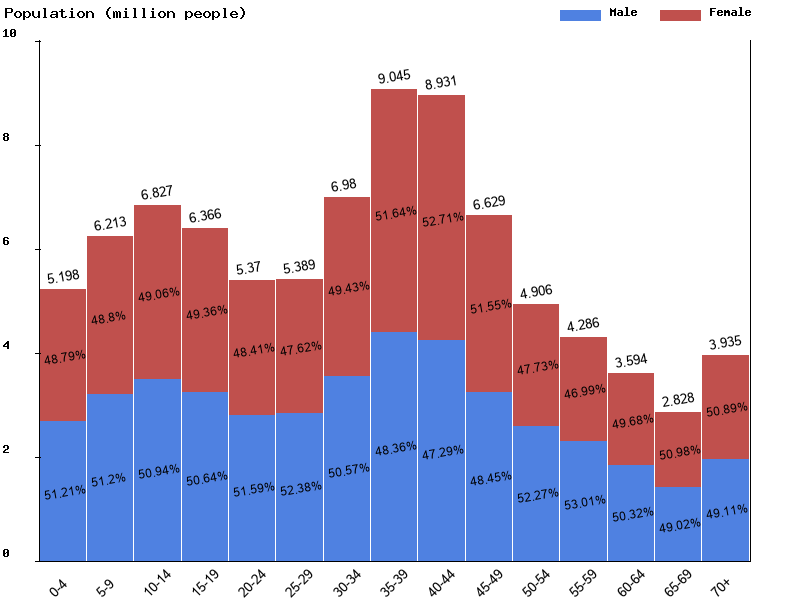
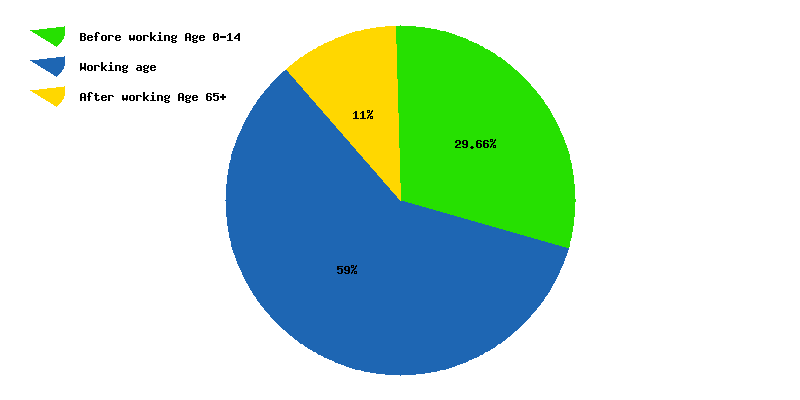
| Age | Both Sexes Population | Male Population | Female Population | Both Sexes (%) | Male (%) | Female (%) | Sex ratio (female/male) |
|---|---|---|---|---|---|---|---|
| Total | 86,496,638 | 43,439,198 | 43,057,440 | 100 | 100 | 100 | 100.9 |
| 00-04 | 5,197,692 | 2,661,635 | 2,536,057 | 6 | 6.1 | 5.9 | 105 |
| 05-09 | 6,213,269 | 3,181,079 | 3,032,190 | 7.2 | 7.3 | 7 | 104.9 |
| 10-14 | 6,826,868 | 3,477,637 | 3,349,231 | 7.9 | 8 | 7.8 | 103.8 |
| 15-19 | 6,365,995 | 3,223,650 | 3,142,345 | 7.4 | 7.4 | 7.3 | 102.6 |
| 20-24 | 5,369,581 | 2,770,349 | 2,599,232 | 6.2 | 6.4 | 6 | 106.6 |
| 25-29 | 5,388,721 | 2,822,589 | 2,566,132 | 6.2 | 6.5 | 6 | 110 |
| 30-34 | 6,979,530 | 3,529,245 | 3,450,285 | 8.1 | 8.1 | 8 | 102.3 |
| 35-39 | 9,044,879 | 4,373,848 | 4,671,031 | 10.5 | 10.1 | 10.8 | 93.6 |
| 40-44 | 8,931,494 | 4,223,482 | 4,708,012 | 10.3 | 9.7 | 10.9 | 89.7 |
| 45-49 | 6,629,301 | 3,212,073 | 3,417,228 | 7.7 | 7.4 | 7.9 | 94 |
| 50-54 | 4,906,043 | 2,564,239 | 2,341,804 | 5.7 | 5.9 | 5.4 | 109.5 |
| 55-59 | 4,286,048 | 2,271,874 | 2,014,174 | 5 | 5.2 | 4.7 | 112.8 |
| 60-64 | 3,594,056 | 1,808,469 | 1,785,587 | 4.2 | 4.2 | 4.1 | 101.3 |
| 65-69 | 2,828,453 | 1,386,513 | 1,441,940 | 3.3 | 3.2 | 3.3 | 96.2 |
| 70-74 | 2,075,129 | 1,008,138 | 1,066,991 | 2.4 | 2.3 | 2.5 | 94.5 |
| 75-79 | 1,015,854 | 491,481 | 524,373 | 1.2 | 1.1 | 1.2 | 93.7 |
| 80-84 | 502,036 | 258,289 | 243,747 | 0.6 | 0.6 | 0.6 | 106 |
| 85-89 | 249,049 | 128,493 | 120,556 | 0.3 | 0.3 | 0.3 | 106.6 |
| 90-94 | 79,013 | 39,634 | 39,379 | 0.1 | 0.1 | 0.1 | 100.6 |
| 95-99 | 12,476 | 5,943 | 6,533 | 0 | 0 | 0 | 91 |
| 100+ | 1,151 | 538 | 613 | 0 | 0 | 0 | 87.8 |
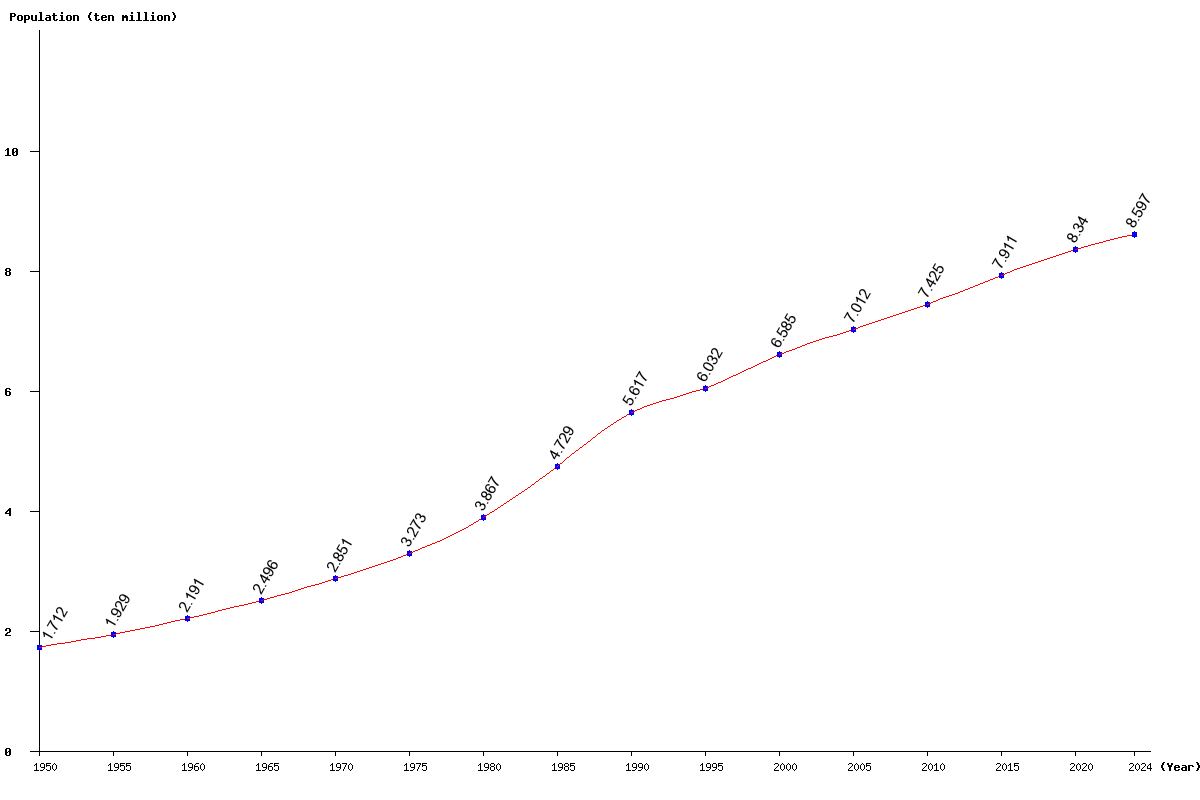
| Year | Population | Yearly % Change |
Yearly Change |
Sex ratio | Density (P/Km²) |
|---|---|---|---|---|---|
| 2025 | 86,496,638 | 0.61 | 523,043 | 100.89 | 53.11 |
| 2024 | 85,973,595 | 0.66 | 567,496 | 100.94 | 52.79 |
| 2023 | 85,406,099 | 0.73 | 615,446 | 100.99 | 52.44 |
| 2022 | 84,790,653 | 0.79 | 667,046 | 101.05 | 52.07 |
| 2021 | 84,123,607 | 0.86 | 720,327 | 101.10 | 51.66 |
| 2020 | 83,403,280 | 0.93 | 772,335 | 101.15 | 51.21 |
| 2019 | 82,630,945 | 1.00 | 820,662 | 101.20 | 50.74 |
| 2018 | 81,810,283 | 1.07 | 864,565 | 101.24 | 50.24 |
| 2017 | 80,945,718 | 1.13 | 902,572 | 101.29 | 49.70 |
| 2016 | 80,043,146 | 1.18 | 933,874 | 101.35 | 49.15 |
| 2015 | 79,109,272 | 1.24 | 965,628 | 101.43 | 48.58 |
| 2014 | 78,143,644 | 1.28 | 991,199 | 101.52 | 47.98 |
| 2013 | 77,152,445 | 1.31 | 995,470 | 101.62 | 47.37 |
| 2012 | 76,156,975 | 1.29 | 972,653 | 101.76 | 46.76 |
| 2011 | 75,184,322 | 1.25 | 930,949 | 101.97 | 46.17 |
| 2010 | 74,253,373 | 1.20 | 882,391 | 102.27 | 45.59 |
| 2005 | 70,122,115 | 6.49 | 4,272,053 | 104.29 | 43.06 |
| 2000 | 65,850,062 | 9.17 | 5,531,430 | 102.76 | 40.43 |
| 1995 | 60,318,632 | 7.39 | 4,149,436 | 102.90 | 37.04 |
| 1990 | 56,169,196 | 18.77 | 8,878,403 | 103.87 | 34.49 |
| 1985 | 47,290,793 | 22.30 | 8,622,571 | 104.33 | 29.04 |
| 1980 | 38,668,222 | 18.14 | 5,937,667 | 106.31 | 23.74 |
| 1975 | 32,730,555 | 14.79 | 4,216,544 | 105.69 | 20.10 |
| 1970 | 28,514,011 | 14.26 | 3,558,895 | 105.71 | 17.51 |
| 1965 | 24,955,116 | 13.91 | 3,048,211 | 105.72 | 15.32 |
| 1960 | 21,906,905 | 13.54 | 2,612,907 | 105.42 | 13.45 |
| 1955 | 19,293,998 | 12.70 | 2,174,735 | 104.78 | 11.85 |
| 1950 | 17,119,263 | 103.57 | 10.51 |