Indonesia population
284,127,975
Births this year: 42,331,556
Births today 2,543
Deaths this year 16,519,632
Deaths today 992
284,127,975
| Region Name | Percents | Number |
|---|---|---|
| Muslim | 87.2% | 225,251,596 people |
| Christian | 7% | 18,082,124 people |
| Roman Catholic | 2.9% | 7,491,165 people |
| Hindu | 1.7% | 4,391,373 people |
| other (includes Buddhist and Confucian) | 0.9% | 2,324,844 people |
| unspecified | 0.4% | 1,033,264 people |
| Ethnic groups Name | Percents | Number |
|---|---|---|
| Javanese | 40.1% | 103,584,736 people |
| Sundanese | 15.5% | 40,038,988 people |
| Malay | 3.7% | 9,557,694 people |
| Batak | 3.6% | 9,299,378 people |
| Madurese | 3% | 7,749,482 people |
| Betawi | 2.9% | 7,491,165 people |
| Minangkabau | 2.7% | 6,974,533 people |
| Buginese | 2.7% | 6,974,533 people |
| Bantenese | 2% | 5,166,321 people |
| Banjarese | 1.7% | 4,391,373 people |
| Balinese | 1.7% | 4,391,373 people |
| Acehnese | 1.4% | 3,616,425 people |
| Dayak | 1.4% | 3,616,425 people |
| Sasak | 1.3% | 3,358,109 people |
| Chinese | 1.2% | 3,099,793 people |
| other | 15% | 38,747,408 people |
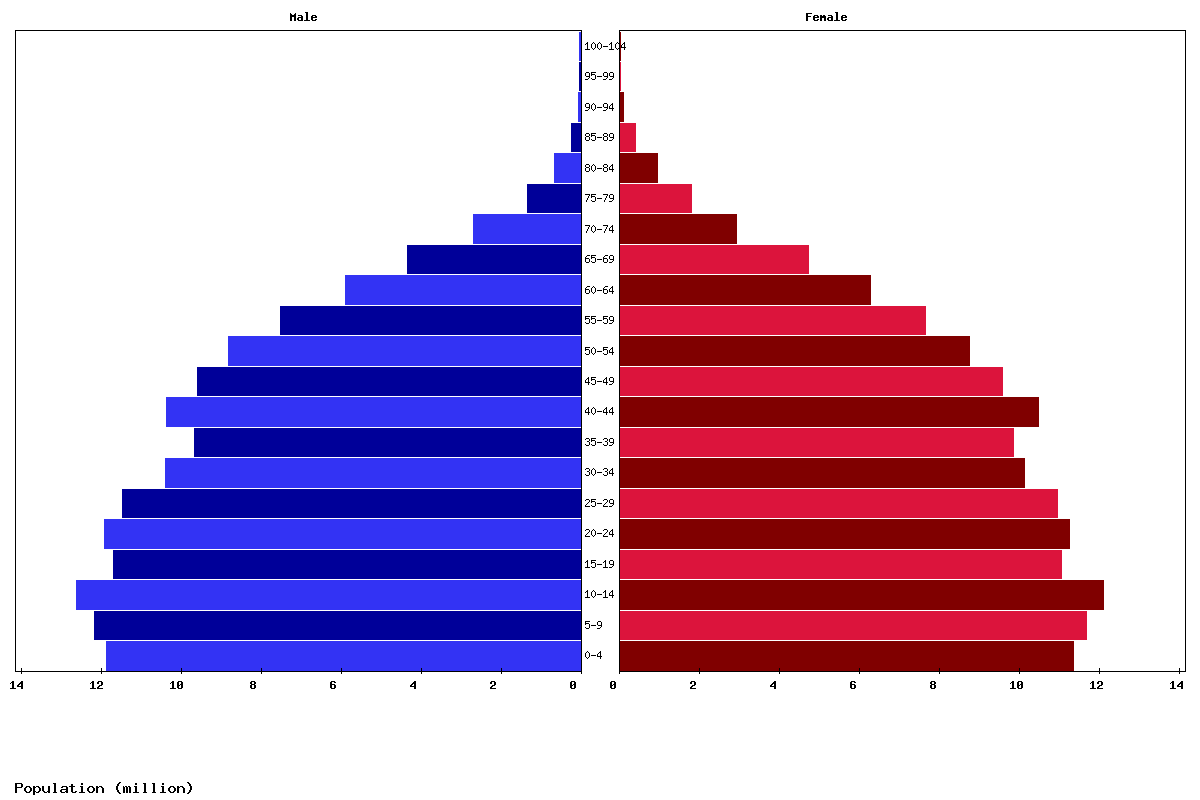
| Age | Both Sexes Population | Male Population | Female Population | Both Sexes (%) | Male (%) | Female (%) | Sex ratio (female/male) |
|---|---|---|---|---|---|---|---|
| Total | 284,504,973 | 142,793,106 | 141,711,867 | 100 | 100 | 100 | 100.8 |
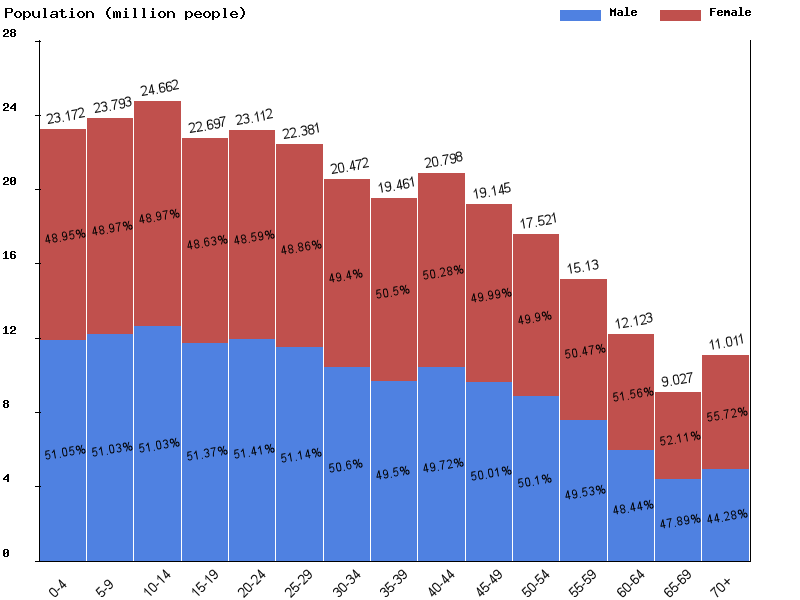
| 00-04 | 23,172,322 | 11,829,783 | 11,342,539 | 8.1 | 8.3 | 8 | 104.3 |
| 05-09 | 23,793,165 | 12,141,461 | 11,651,704 | 8.4 | 8.5 | 8.2 | 104.2 |
| 10-14 | 24,662,146 | 12,584,144 | 12,078,002 | 8.7 | 8.8 | 8.5 | 104.2 |
| 15-19 | 22,697,120 | 11,659,978 | 11,037,142 | 8 | 8.2 | 7.8 | 105.6 |
| 20-24 | 23,111,925 | 11,881,886 | 11,230,039 | 8.1 | 8.3 | 7.9 | 105.8 |
| 25-29 | 22,380,544 | 11,445,849 | 10,934,695 | 7.9 | 8 | 7.7 | 104.7 |
| 30-34 | 20,472,207 | 10,359,030 | 10,113,177 | 7.2 | 7.3 | 7.1 | 102.4 |
| 35-39 | 19,460,946 | 9,634,086 | 9,826,860 | 6.8 | 6.7 | 6.9 | 98 |
| 40-44 | 20,798,258 | 10,340,354 | 10,457,904 | 7.3 | 7.2 | 7.4 | 98.9 |
| 45-49 | 19,144,709 | 9,573,761 | 9,570,948 | 6.7 | 6.7 | 6.8 | 100 |
| 50-54 | 17,520,853 | 8,777,589 | 8,743,264 | 6.2 | 6.1 | 6.2 | 100.4 |
| 55-59 | 15,130,019 | 7,494,149 | 7,635,870 | 5.3 | 5.2 | 5.4 | 98.1 |
| 60-64 | 12,122,683 | 5,872,028 | 6,250,655 | 4.3 | 4.1 | 4.4 | 93.9 |
| 65-69 | 9,027,422 | 4,323,442 | 4,703,980 | 3.2 | 3 | 3.3 | 91.9 |
| 70-74 | 5,588,211 | 2,670,278 | 2,917,933 | 2 | 1.9 | 2.1 | 91.5 |
| 75-79 | 3,102,810 | 1,317,049 | 1,785,761 | 1.1 | 0.9 | 1.3 | 73.8 |
| 80-84 | 1,570,621 | 628,389 | 942,232 | 0.6 | 0.4 | 0.7 | 66.7 |
| 85-89 | 601,535 | 212,793 | 388,742 | 0.2 | 0.1 | 0.3 | 54.7 |
| 90-94 | 127,954 | 41,061 | 86,893 | 0 | 0 | 0.1 | 47.3 |
| 95-99 | 18,423 | 5,684 | 12,739 | 0 | 0 | 0 | 44.6 |
| 100+ | 1,100 | 312 | 788 | 0 | 0 | 0 | 39.6 |
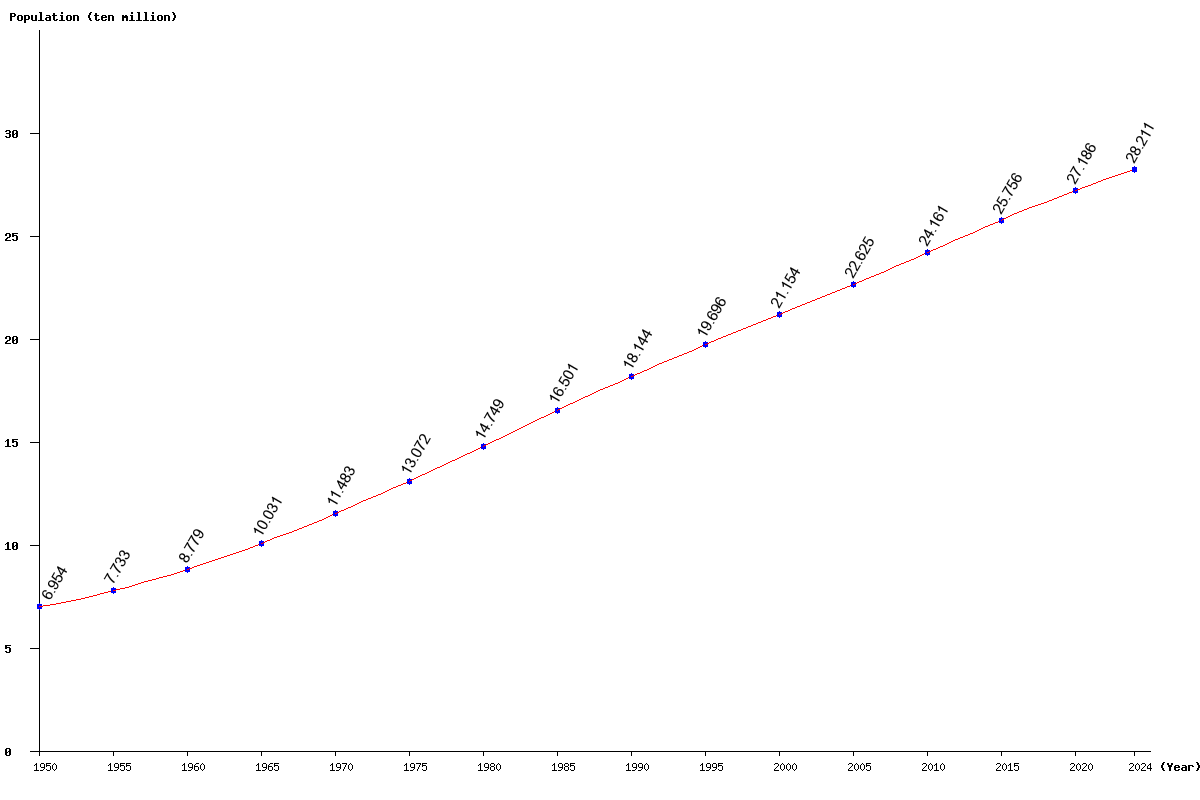
| Year | Population | Yearly % Change |
Yearly Change |
Sex ratio | Density (P/Km²) |
|---|---|---|---|---|---|
| 2025 | 284,504,973 | 0.85 | 2,395,757 | 100.76 | 157.05 |
| 2024 | 282,109,216 | 0.88 | 2,463,320 | 100.84 | 155.73 |
| 2023 | 279,645,896 | 0.91 | 2,530,306 | 100.92 | 154.37 |
| 2022 | 277,115,590 | 0.95 | 2,596,377 | 101.00 | 152.97 |
| 2021 | 274,519,213 | 0.98 | 2,661,793 | 101.07 | 151.54 |
| 2020 | 271,857,420 | 1.01 | 2,720,999 | 101.13 | 150.07 |
| 2019 | 269,136,421 | 1.04 | 2,779,123 | 101.20 | 148.57 |
| 2018 | 266,357,298 | 1.08 | 2,847,152 | 101.25 | 147.03 |
| 2017 | 263,510,146 | 1.12 | 2,929,046 | 101.30 | 145.46 |
| 2016 | 260,581,100 | 1.17 | 3,017,285 | 101.36 | 143.84 |
| 2015 | 257,563,815 | 1.22 | 3,109,037 | 101.42 | 142.18 |
| 2014 | 254,454,778 | 1.27 | 3,186,502 | 101.48 | 140.46 |
| 2013 | 251,268,276 | 1.30 | 3,230,423 | 101.56 | 138.70 |
| 2012 | 248,037,853 | 1.32 | 3,229,599 | 101.62 | 136.92 |
| 2011 | 244,808,254 | 1.32 | 3,195,128 | 101.64 | 135.14 |
| 2010 | 241,613,126 | 1.32 | 3,147,961 | 101.61 | 133.37 |
| 2005 | 226,254,703 | 6.96 | 14,714,275 | 100.82 | 124.89 |
| 2000 | 211,540,428 | 7.40 | 14,582,583 | 100.19 | 116.77 |
| 1995 | 196,957,845 | 8.55 | 15,521,024 | 100.09 | 108.72 |
| 1990 | 181,436,821 | 9.95 | 16,424,626 | 100.88 | 100.15 |
| 1985 | 165,012,195 | 11.88 | 17,521,829 | 99.99 | 91.09 |
| 1980 | 147,490,366 | 12.83 | 16,766,248 | 99.83 | 81.42 |
| 1975 | 130,724,118 | 13.84 | 15,889,337 | 99.63 | 72.16 |
| 1970 | 114,834,781 | 14.48 | 14,525,885 | 99.41 | 63.39 |
| 1965 | 100,308,896 | 14.26 | 12,516,384 | 99.15 | 55.37 |
| 1960 | 87,792,512 | 13.53 | 10,464,713 | 98.82 | 48.46 |
| 1955 | 77,327,799 | 11.19 | 7,784,480 | 98.57 | 42.69 |
| 1950 | 69,543,319 | 98.43 | 38.39 |