Fiji population
1,028,916
Births this year: 167,337
Births today 5
Deaths this year 53,724
Deaths today 2
1,028,916
| Region Name | Percents | Number |
|---|---|---|
| Protestant (Methodist, Assembly of God, Seventh Day Adventist, and Anglican) | 45% | 411,886 people |
| Hindu | 27.9% | 255,370 people |
| other Christian | 10.4% | 95,192 people |
| Roman Catholic | 9.1% | 83,293 people |
| Muslim | 6.3% | 57,664 people |
| Sikh | 0.3% | 2,746 people |
| other | 0.3% | 2,746 people |
| none | 0.8% | 7,322 people |
| Ethnic groups Name | Percents | Number |
|---|---|---|
| iTaukei (predominantly Melanesian with a Polynesian admixture) | 56.8% | 519,892 people |
| Indian | 37.5% | 343,239 people |
| Rotuman | 1.2% | 10,984 people |
| other (European, part European, other Pacific Islanders, Chinese) | 4.5% | 41,189 people |
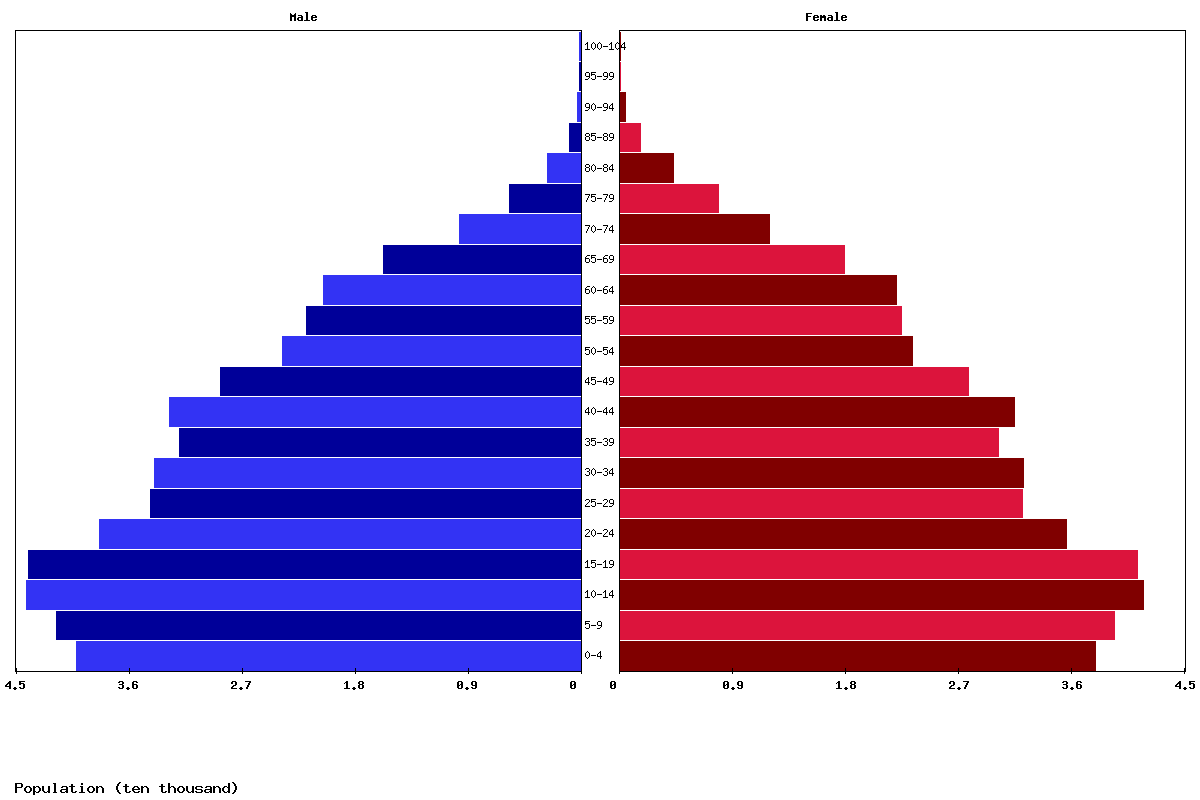
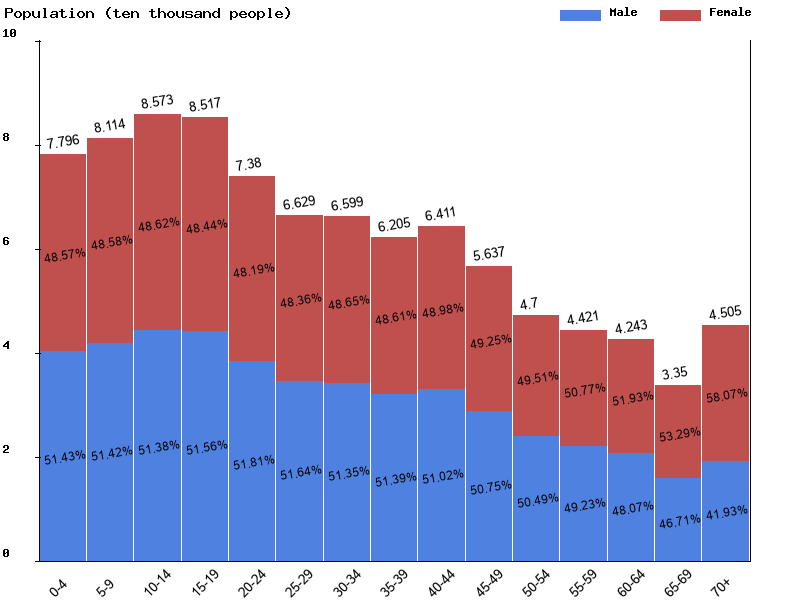
| Age | Both Sexes Population | Male Population | Female Population | Both Sexes (%) | Male (%) | Female (%) | Sex ratio (female/male) |
|---|---|---|---|---|---|---|---|
| Total | 930,804 | 469,768 | 461,036 | 100 | 100 | 100 | 101.9 |
| 00-04 | 77,964 | 40,099 | 37,865 | 8.4 | 8.5 | 8.2 | 105.9 |
| 05-09 | 81,136 | 41,719 | 39,417 | 8.7 | 8.9 | 8.5 | 105.8 |
| 10-14 | 85,727 | 44,046 | 41,681 | 9.2 | 9.4 | 9 | 105.7 |
| 15-19 | 85,170 | 43,914 | 41,256 | 9.2 | 9.3 | 8.9 | 106.4 |
| 20-24 | 73,801 | 38,237 | 35,564 | 7.9 | 8.1 | 7.7 | 107.5 |
| 25-29 | 66,292 | 34,233 | 32,059 | 7.1 | 7.3 | 7 | 106.8 |
| 30-34 | 65,994 | 33,887 | 32,107 | 7.1 | 7.2 | 7 | 105.5 |
| 35-39 | 62,049 | 31,889 | 30,160 | 6.7 | 6.8 | 6.5 | 105.7 |
| 40-44 | 64,114 | 32,708 | 31,406 | 6.9 | 7 | 6.8 | 104.1 |
| 45-49 | 56,369 | 28,609 | 27,760 | 6.1 | 6.1 | 6 | 103.1 |
| 50-54 | 47,002 | 23,731 | 23,271 | 5 | 5.1 | 5 | 102 |
| 55-59 | 44,207 | 21,761 | 22,446 | 4.7 | 4.6 | 4.9 | 96.9 |
| 60-64 | 42,429 | 20,397 | 22,032 | 4.6 | 4.3 | 4.8 | 92.6 |
| 65-69 | 33,503 | 15,649 | 17,854 | 3.6 | 3.3 | 3.9 | 87.6 |
| 70-74 | 21,509 | 9,606 | 11,903 | 2.3 | 2 | 2.6 | 80.7 |
| 75-79 | 13,441 | 5,626 | 7,815 | 1.4 | 1.2 | 1.7 | 72 |
| 80-84 | 6,908 | 2,608 | 4,300 | 0.7 | 0.6 | 0.9 | 60.7 |
| 85-89 | 2,442 | 828 | 1,614 | 0.3 | 0.2 | 0.4 | 51.3 |
| 90-94 | 637 | 190 | 447 | 0.1 | 0 | 0.1 | 42.5 |
| 95-99 | 99 | 28 | 71 | 0 | 0 | 0 | 39.4 |
| 100+ | 11 | 3 | 8 | 0 | 0 | 0 | 37.5 |


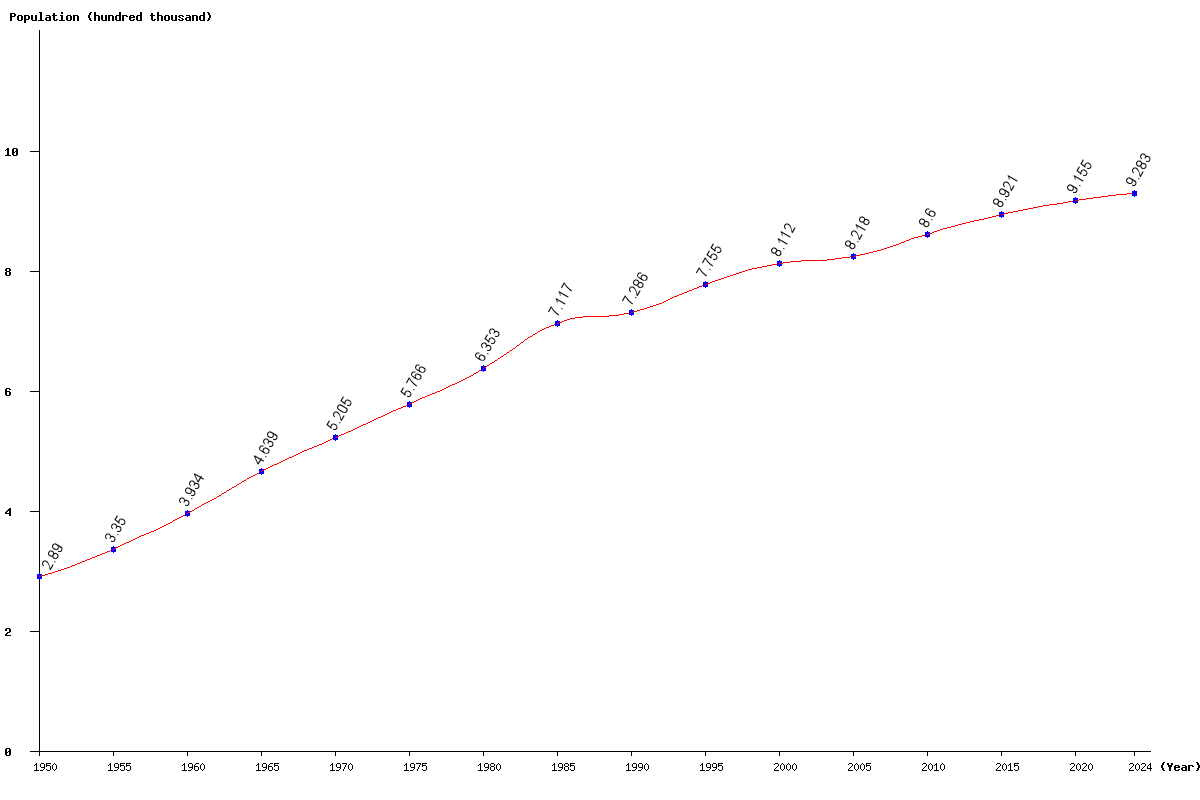
| Year | Population | Yearly % Change |
Yearly Change |
Sex ratio | Density (P/Km²) |
|---|---|---|---|---|---|
| 2025 | 930,804 | 0.27 | 2,531 | 101.89 | 50.95 |
| 2024 | 928,273 | 0.30 | 2,775 | 102.04 | 50.81 |
| 2023 | 925,498 | 0.33 | 3,044 | 102.19 | 50.66 |
| 2022 | 922,454 | 0.36 | 3,338 | 102.34 | 50.49 |
| 2021 | 919,116 | 0.40 | 3,656 | 102.50 | 50.31 |
| 2020 | 915,460 | 0.44 | 3,975 | 102.65 | 50.11 |
| 2019 | 911,485 | 0.47 | 4,297 | 102.81 | 49.89 |
| 2018 | 907,188 | 0.51 | 4,641 | 102.96 | 49.65 |
| 2017 | 902,547 | 0.56 | 5,010 | 103.11 | 49.40 |
| 2016 | 897,537 | 0.60 | 5,392 | 103.27 | 49.13 |
| 2015 | 892,145 | 0.64 | 5,695 | 103.45 | 48.83 |
| 2014 | 886,450 | 0.68 | 5,963 | 103.63 | 48.52 |
| 2013 | 880,487 | 0.72 | 6,329 | 103.82 | 48.19 |
| 2012 | 874,158 | 0.79 | 6,831 | 104.00 | 47.85 |
| 2011 | 867,327 | 0.86 | 7,375 | 104.15 | 47.47 |
| 2010 | 859,952 | 0.95 | 8,098 | 104.25 | 47.07 |
| 2005 | 821,820 | 1.31 | 10,597 | 104.04 | 44.98 |
| 2000 | 811,223 | 4.61 | 35,725 | 103.21 | 44.40 |
| 1995 | 775,498 | 6.43 | 46,872 | 103.34 | 42.45 |
| 1990 | 728,626 | 2.38 | 16,963 | 103.22 | 39.88 |
| 1985 | 711,663 | 12.03 | 76,407 | 102.67 | 38.95 |
| 1980 | 635,256 | 10.17 | 58,664 | 102.54 | 34.77 |
| 1975 | 576,592 | 10.77 | 56,063 | 102.30 | 31.56 |
| 1970 | 520,529 | 12.21 | 56,645 | 103.49 | 28.49 |
| 1965 | 463,884 | 17.92 | 70,501 | 104.12 | 25.39 |
| 1960 | 393,383 | 17.44 | 58,407 | 106.21 | 21.53 |
| 1955 | 334,976 | 15.91 | 45,983 | 103.83 | 18.33 |
| 1950 | 288,993 | 109.42 | 15.82 |
