Europe population
554,790,055
Births this year: 52,638,991
Births today 2,854
Deaths this year 12,901,713
Deaths today 700
554,790,055
| Region Name | Percents | Number |
|---|---|---|
| Roman Catholic, Protestant, Orthodox, Muslim, Jewish | 100% | 515,052,778 people |
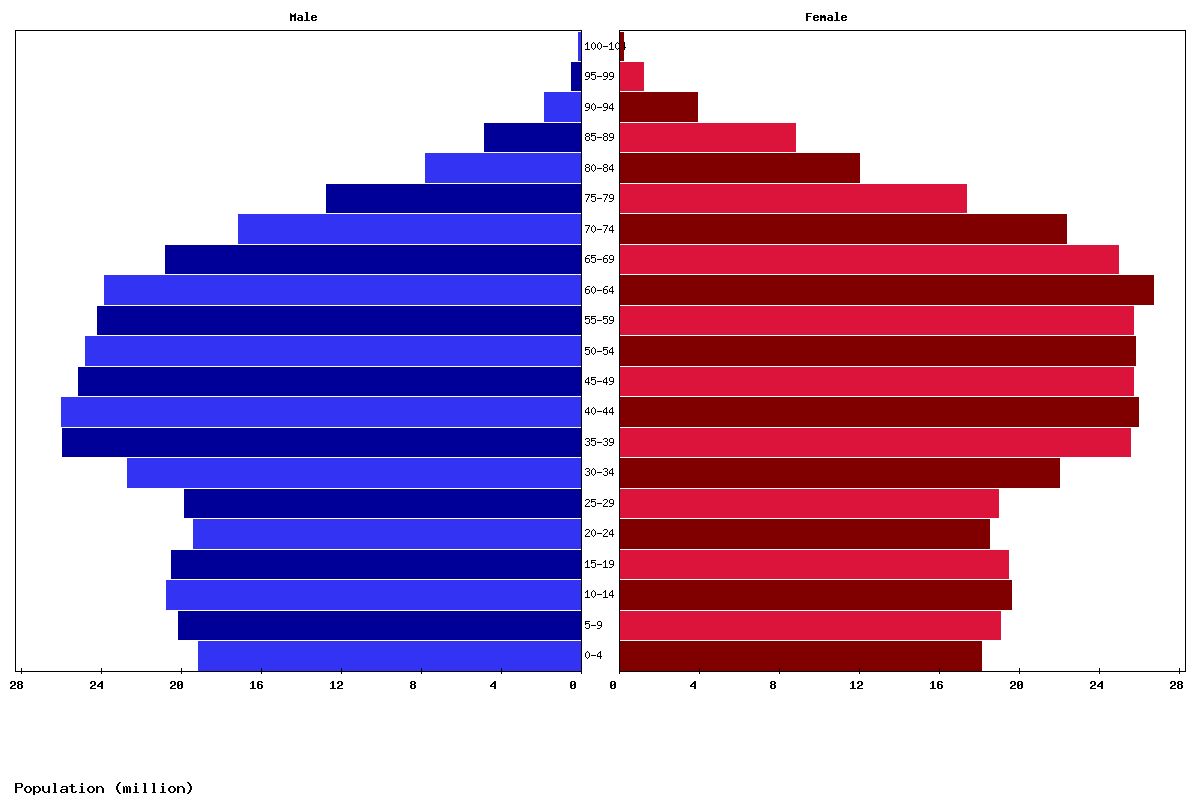
| Age | Both Sexes Population | Male Population | Female Population | Both Sexes (%) | Male (%) | Female (%) | Sex ratio (female/male) |
|---|---|---|---|---|---|---|---|
| Total | 738,089,844 | 356,779,037 | 381,310,807 | 100 | 100 | 100 | 93.6 |
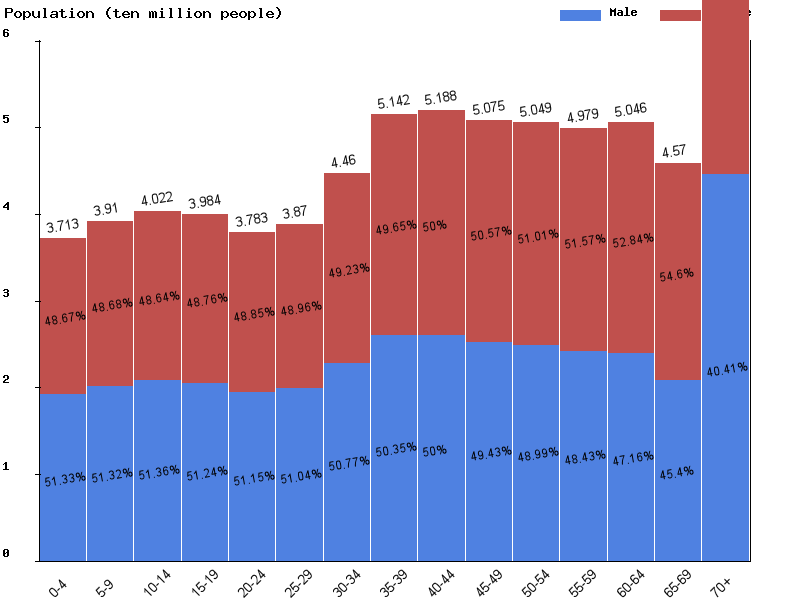
| 00-04 | 37,131,876 | 19,059,684 | 18,072,192 | 5 | 5.3 | 4.7 | 105.5 |
| 05-09 | 39,102,608 | 20,068,693 | 19,033,915 | 5.3 | 5.6 | 5 | 105.4 |
| 10-14 | 40,220,077 | 20,656,365 | 19,563,712 | 5.4 | 5.8 | 5.1 | 105.6 |
| 15-19 | 39,836,712 | 20,410,923 | 19,425,789 | 5.4 | 5.7 | 5.1 | 105.1 |
| 20-24 | 37,828,717 | 19,349,818 | 18,478,899 | 5.1 | 5.4 | 4.8 | 104.7 |
| 25-29 | 38,704,153 | 19,754,392 | 18,949,761 | 5.2 | 5.5 | 5 | 104.2 |
| 30-34 | 44,599,457 | 22,642,001 | 21,957,456 | 6 | 6.3 | 5.8 | 103.1 |
| 35-39 | 51,417,983 | 25,889,341 | 25,528,642 | 7 | 7.3 | 6.7 | 101.4 |
| 40-44 | 51,878,342 | 25,940,223 | 25,938,119 | 7 | 7.3 | 6.8 | 100 |
| 45-49 | 50,752,555 | 25,088,120 | 25,664,435 | 6.9 | 7 | 6.7 | 97.8 |
| 50-54 | 50,490,201 | 24,737,581 | 25,752,620 | 6.8 | 6.9 | 6.8 | 96.1 |
| 55-59 | 49,789,661 | 24,113,542 | 25,676,119 | 6.7 | 6.8 | 6.7 | 93.9 |
| 60-64 | 50,460,103 | 23,798,337 | 26,661,766 | 6.8 | 6.7 | 7 | 89.3 |
| 65-69 | 45,695,435 | 20,746,259 | 24,949,176 | 6.2 | 5.8 | 6.5 | 83.2 |
| 70-74 | 39,398,447 | 17,058,301 | 22,340,146 | 5.3 | 4.8 | 5.9 | 76.4 |
| 75-79 | 30,012,973 | 12,696,075 | 17,316,898 | 4.1 | 3.6 | 4.5 | 73.3 |
| 80-84 | 19,694,266 | 7,743,515 | 11,950,751 | 2.7 | 2.2 | 3.1 | 64.8 |
| 85-89 | 13,545,770 | 4,753,840 | 8,791,930 | 1.8 | 1.3 | 2.3 | 54.1 |
| 90-94 | 5,670,283 | 1,791,306 | 3,878,977 | 0.8 | 0.5 | 1 | 46.2 |
| 95-99 | 1,618,586 | 429,435 | 1,189,151 | 0.2 | 0.1 | 0.3 | 36.1 |
| 100+ | 241,639 | 51,286 | 190,353 | 0 | 0 | 0 | 26.9 |
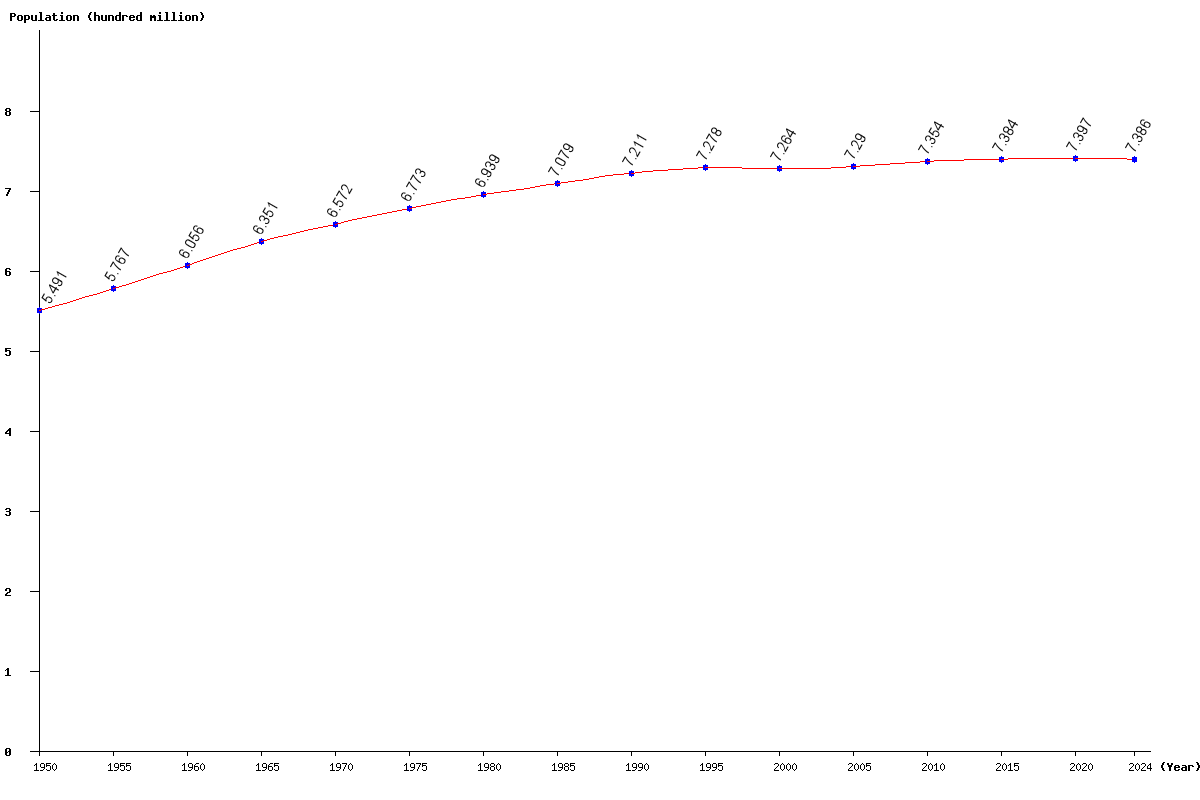
| Year | Population | Yearly % Change |
Yearly Change |
Sex ratio | Density (P/Km²) |
|---|---|---|---|---|---|
| 2025 | 738,089,844 | -0.07 | -550,545 | 93.57 | 33.35 |
| 2024 | 738,640,389 | -0.06 | -447,612 | 93.54 | 33.37 |
| 2023 | 739,088,001 | -0.05 | -335,977 | 93.51 | 33.39 |
| 2022 | 739,423,978 | -0.03 | -214,288 | 93.48 | 33.41 |
| 2021 | 739,638,266 | -0.01 | -86,996 | 93.45 | 33.42 |
| 2020 | 739,725,262 | 0.01 | 49,361 | 93.41 | 33.42 |
| 2019 | 739,675,901 | 0.02 | 180,886 | 93.36 | 33.42 |
| 2018 | 739,495,015 | 0.04 | 287,273 | 93.31 | 33.41 |
| 2017 | 739,207,742 | 0.05 | 358,740 | 93.26 | 33.40 |
| 2016 | 738,849,002 | 0.06 | 406,932 | 93.21 | 33.38 |
| 2015 | 738,442,070 | 0.06 | 426,327 | 93.17 | 33.36 |
| 2014 | 738,015,743 | 0.06 | 454,280 | 93.13 | 33.34 |
| 2013 | 737,561,463 | 0.07 | 539,651 | 93.09 | 33.32 |
| 2012 | 737,021,812 | 0.10 | 706,237 | 93.07 | 33.30 |
| 2011 | 736,315,575 | 0.13 | 920,673 | 93.04 | 33.26 |
| 2010 | 735,394,902 | 0.16 | 1,155,265 | 93.03 | 33.22 |
| 2005 | 729,007,470 | 0.36 | 2,600,022 | 93.08 | 32.93 |
| 2000 | 726,407,448 | -0.19 | -1,370,992 | 93.12 | 32.82 |
| 1995 | 727,778,440 | 0.93 | 6,692,129 | 93.11 | 32.88 |
| 1990 | 721,086,311 | 1.86 | 13,187,357 | 92.94 | 32.58 |
| 1985 | 707,898,954 | 2.02 | 14,039,515 | 92.44 | 31.98 |
| 1980 | 693,859,439 | 2.44 | 16,541,647 | 92.15 | 31.35 |
| 1975 | 677,317,792 | 3.06 | 20,096,346 | 91.76 | 30.60 |
| 1970 | 657,221,446 | 3.48 | 22,103,314 | 91.30 | 29.69 |
| 1965 | 635,118,132 | 4.87 | 29,499,566 | 90.63 | 28.69 |
| 1960 | 605,618,566 | 5.02 | 28,954,829 | 89.61 | 27.36 |
| 1955 | 576,663,737 | 5.02 | 27,574,630 | 88.63 | 26.05 |
| 1950 | 549,089,107 | 87.57 | 24.81 |