East Europe population
0
Births this year: 0
Births today 0
Deaths this year 0
Deaths today 0
0
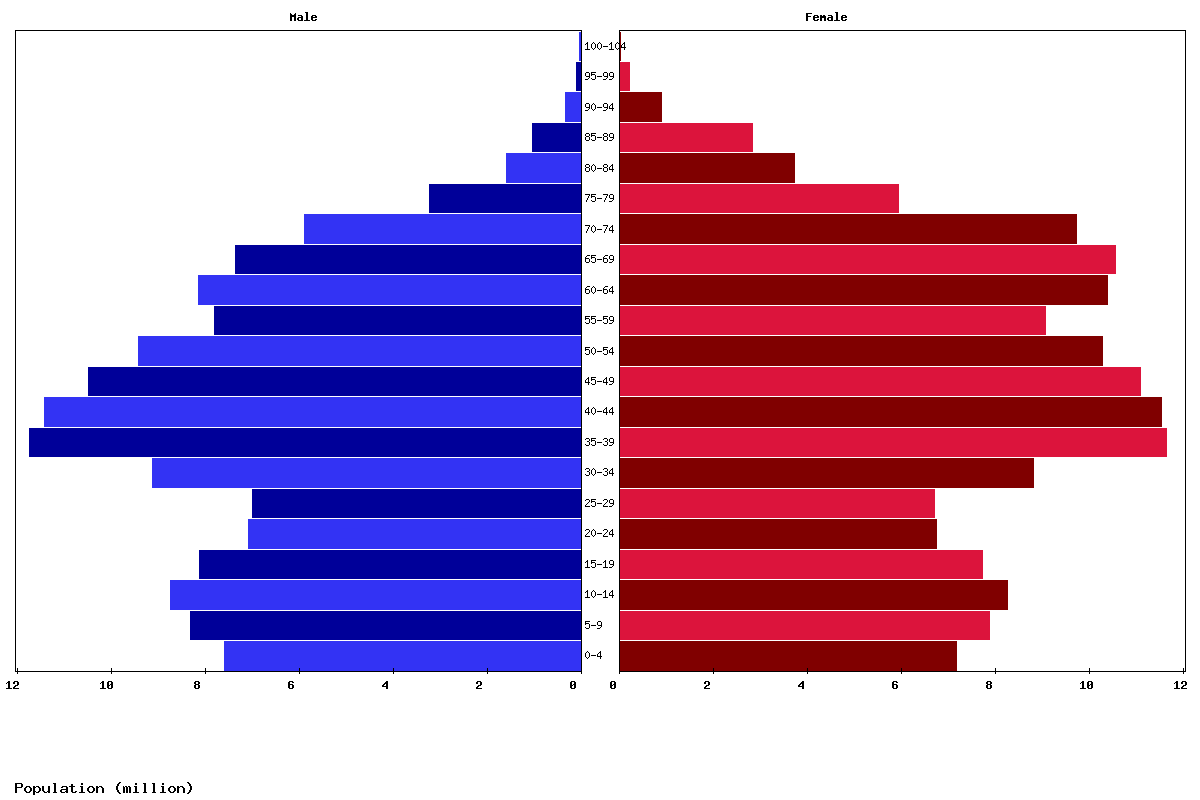
| Age | Both Sexes Population | Male Population | Female Population | Both Sexes (%) | Male (%) | Female (%) | Sex ratio (female/male) |
|---|---|---|---|---|---|---|---|
| Total | 284,929,270 | 133,979,198 | 150,950,072 | 100 | 100 | 100 | 88.8 |
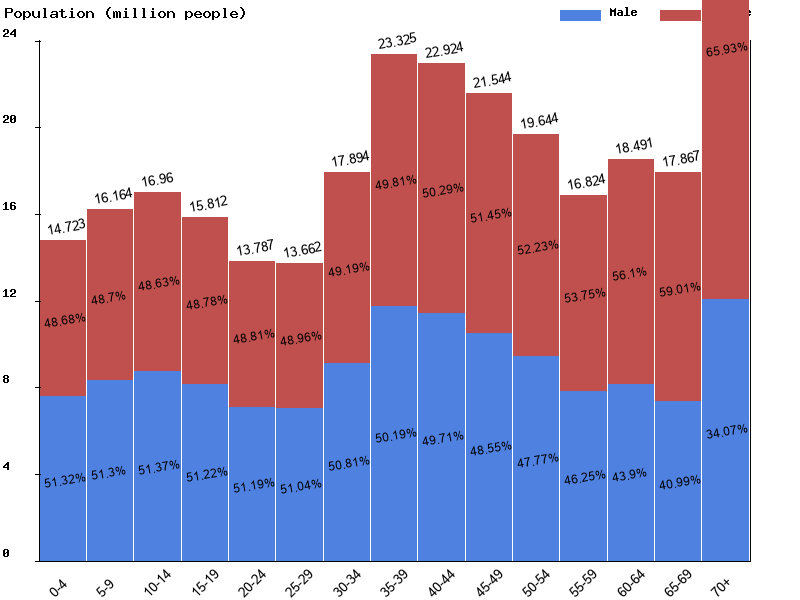
| 00-04 | 14,723,404 | 7,556,148 | 7,167,256 | 5.2 | 5.6 | 4.7 | 105.4 |
| 05-09 | 16,164,131 | 8,292,069 | 7,872,062 | 5.7 | 6.2 | 5.2 | 105.3 |
| 10-14 | 16,959,510 | 8,711,993 | 8,247,517 | 6 | 6.5 | 5.5 | 105.6 |
| 15-19 | 15,812,161 | 8,099,664 | 7,712,497 | 5.5 | 6 | 5.1 | 105 |
| 20-24 | 13,787,128 | 7,058,298 | 6,728,830 | 4.8 | 5.3 | 4.5 | 104.9 |
| 25-29 | 13,662,429 | 6,972,632 | 6,689,797 | 4.8 | 5.2 | 4.4 | 104.2 |
| 30-34 | 17,894,308 | 9,091,856 | 8,802,452 | 6.3 | 6.8 | 5.8 | 103.3 |
| 35-39 | 23,325,344 | 11,707,526 | 11,617,818 | 8.2 | 8.7 | 7.7 | 100.8 |
| 40-44 | 22,924,408 | 11,395,185 | 11,529,223 | 8 | 8.5 | 7.6 | 98.8 |
| 45-49 | 21,543,723 | 10,458,963 | 11,084,760 | 7.6 | 7.8 | 7.3 | 94.4 |
| 50-54 | 19,643,856 | 9,383,668 | 10,260,188 | 6.9 | 7 | 6.8 | 91.5 |
| 55-59 | 16,823,898 | 7,780,322 | 9,043,576 | 5.9 | 5.8 | 6 | 86 |
| 60-64 | 18,491,300 | 8,117,295 | 10,374,005 | 6.5 | 6.1 | 6.9 | 78.2 |
| 65-69 | 17,867,066 | 7,324,050 | 10,543,016 | 6.3 | 5.5 | 7 | 69.5 |
| 70-74 | 15,560,133 | 5,856,757 | 9,703,376 | 5.5 | 4.4 | 6.4 | 60.4 |
| 75-79 | 9,114,308 | 3,194,213 | 5,920,095 | 3.2 | 2.4 | 3.9 | 54 |
| 80-84 | 5,278,141 | 1,570,191 | 3,707,950 | 1.9 | 1.2 | 2.5 | 42.3 |
| 85-89 | 3,833,067 | 1,009,641 | 2,823,426 | 1.3 | 0.8 | 1.9 | 35.8 |
| 90-94 | 1,202,983 | 312,471 | 890,512 | 0.4 | 0.2 | 0.6 | 35.1 |
| 95-99 | 289,341 | 78,352 | 210,989 | 0.1 | 0.1 | 0.1 | 37.1 |
| 100+ | 28,631 | 7,904 | 20,727 | 0 | 0 | 0 | 38.1 |
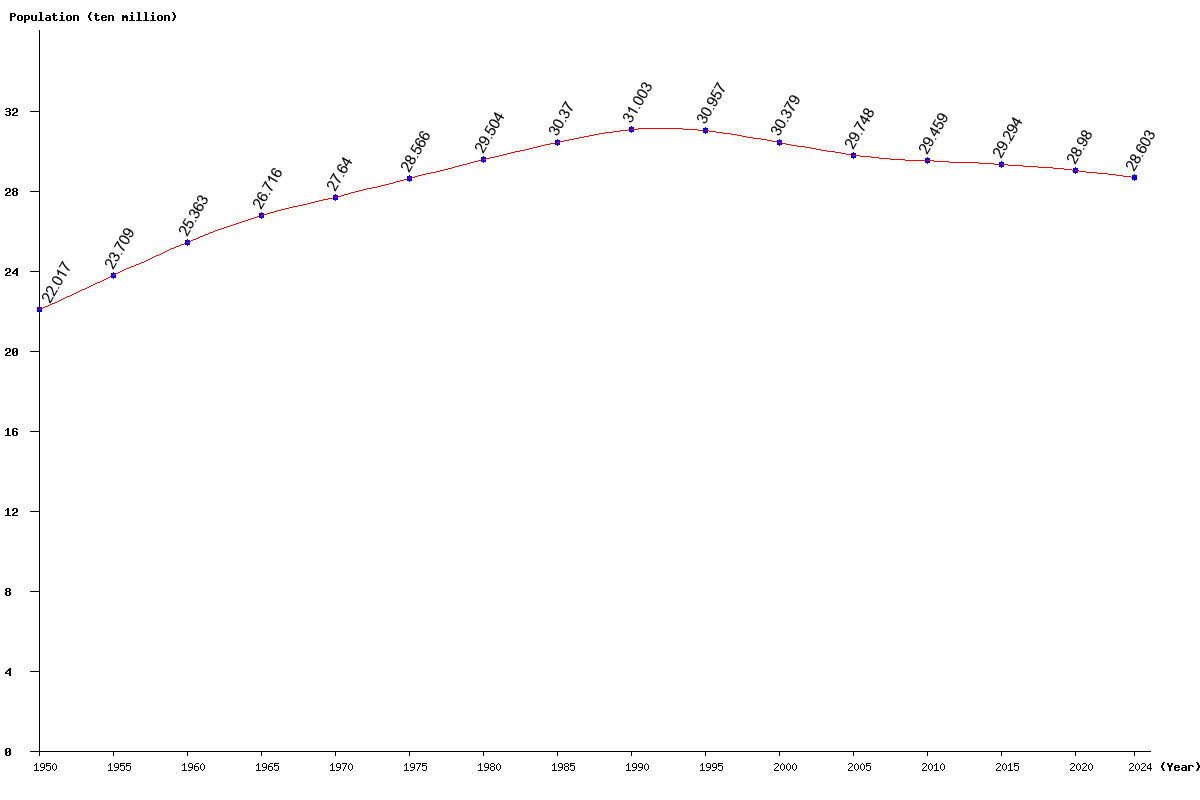
| Year | Population | Yearly % Change |
Yearly Change |
Sex ratio | Density (P/Km²) |
|---|---|---|---|---|---|
| 2024 | 286,033,287 | -0.36 | -1,041,531 | 88.79 | 15.84 |
| 2023 | 287,074,818 | -0.34 | -975,931 | 88.82 | 15.90 |
| 2022 | 288,050,749 | -0.31 | -907,543 | 88.85 | 15.96 |
| 2021 | 288,958,292 | -0.29 | -837,352 | 88.87 | 16.01 |
| 2020 | 289,795,644 | -0.27 | -772,253 | 88.89 | 16.05 |
| 2019 | 290,567,897 | -0.24 | -708,975 | 88.90 | 16.10 |
| 2018 | 291,276,872 | -0.22 | -637,901 | 88.92 | 16.13 |
| 2017 | 291,914,773 | -0.19 | -556,300 | 88.93 | 16.17 |
| 2016 | 292,471,073 | -0.16 | -471,705 | 88.92 | 16.20 |
| 2015 | 292,942,778 | -0.13 | -389,819 | 88.91 | 16.23 |
| 2014 | 293,332,597 | -0.11 | -325,472 | 88.88 | 16.25 |
| 2013 | 293,658,069 | -0.10 | -292,304 | 88.83 | 16.27 |
| 2012 | 293,950,373 | -0.10 | -299,598 | 88.79 | 16.28 |
| 2011 | 294,249,971 | -0.12 | -341,193 | 88.77 | 16.30 |
| 2010 | 294,591,164 | -0.13 | -386,072 | 88.77 | 16.32 |
| 2005 | 297,481,982 | -2.08 | -6,306,523 | 89.19 | 16.48 |
| 2000 | 303,788,505 | -1.87 | -5,780,847 | 89.83 | 16.83 |
| 1995 | 309,569,352 | -0.15 | -457,507 | 90.16 | 17.15 |
| 1990 | 310,026,859 | 2.08 | 6,327,712 | 90.09 | 17.17 |
| 1985 | 303,699,147 | 2.93 | 8,657,234 | 89.34 | 16.82 |
| 1980 | 295,041,913 | 3.29 | 9,384,858 | 88.74 | 16.34 |
| 1975 | 285,657,055 | 3.35 | 9,260,712 | 88.00 | 15.82 |
| 1970 | 276,396,343 | 3.46 | 9,232,045 | 87.42 | 15.31 |
| 1965 | 267,164,298 | 5.34 | 13,534,524 | 86.56 | 14.80 |
| 1960 | 253,629,774 | 6.97 | 16,534,856 | 85.28 | 14.05 |
| 1955 | 237,094,918 | 7.69 | 16,924,383 | 83.54 | 13.13 |
| 1950 | 220,170,535 | 81.54 | 12.20 |