East Asia population
0
Births this year: 0
Births today 0
Deaths this year 0
Deaths today 0
0
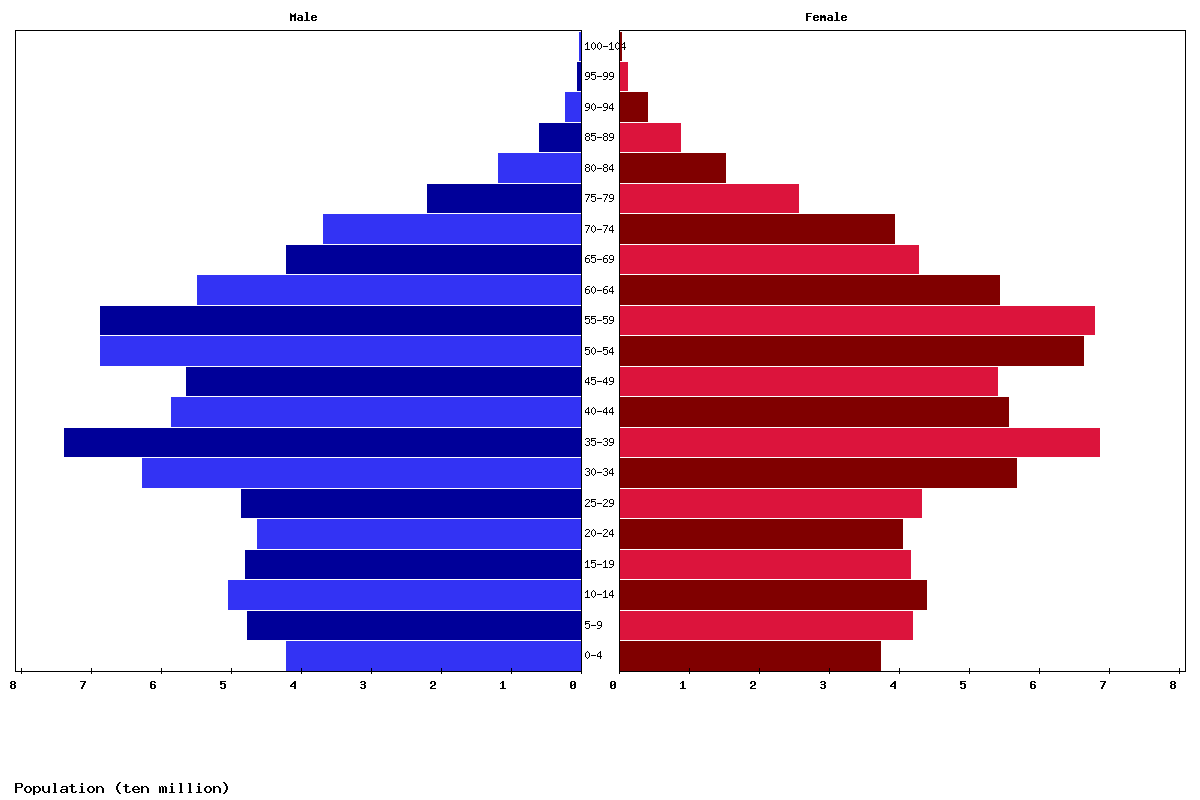
| Age | Both Sexes Population | Male Population | Female Population | Both Sexes (%) | Male (%) | Female (%) | Sex ratio (female/male) |
|---|---|---|---|---|---|---|---|
| Total | 1,651,107,935 | 844,475,836 | 806,632,099 | 100 | 100 | 100 | 104.7 |
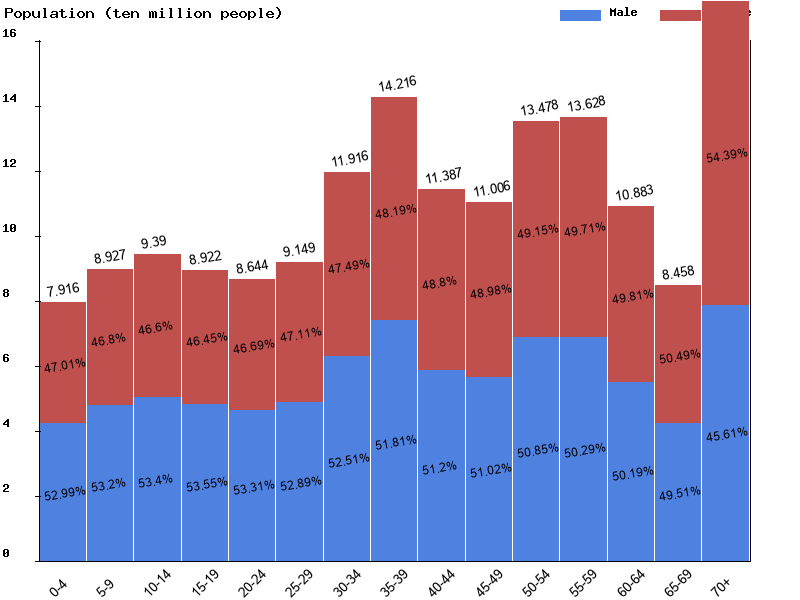
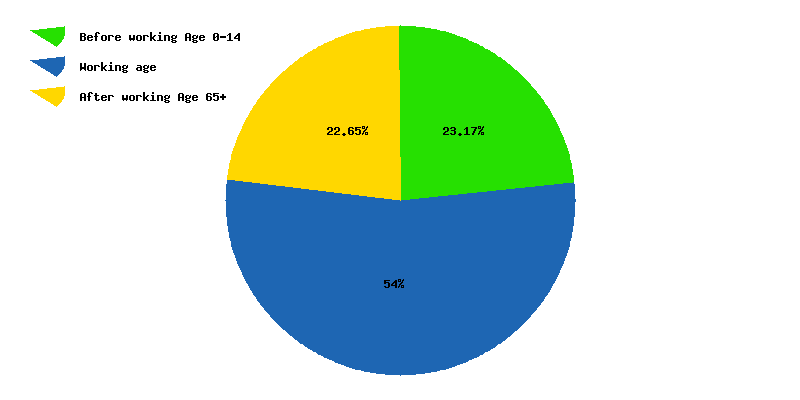
| 00-04 | 79,160,287 | 41,945,047 | 37,215,240 | 4.8 | 5 | 4.6 | 112.7 |
| 05-09 | 89,265,199 | 47,485,915 | 41,779,284 | 5.4 | 5.6 | 5.2 | 113.7 |
| 10-14 | 93,901,075 | 50,146,416 | 43,754,659 | 5.7 | 5.9 | 5.4 | 114.6 |
| 15-19 | 89,219,068 | 47,776,777 | 41,442,291 | 5.4 | 5.7 | 5.1 | 115.3 |
| 20-24 | 86,439,569 | 46,078,015 | 40,361,554 | 5.2 | 5.5 | 5 | 114.2 |
| 25-29 | 91,487,852 | 48,391,676 | 43,096,176 | 5.5 | 5.7 | 5.3 | 112.3 |
| 30-34 | 119,155,180 | 62,562,832 | 56,592,348 | 7.2 | 7.4 | 7 | 110.5 |
| 35-39 | 142,161,576 | 73,656,132 | 68,505,444 | 8.6 | 8.7 | 8.5 | 107.5 |
| 40-44 | 113,872,078 | 58,302,750 | 55,569,328 | 6.9 | 6.9 | 6.9 | 104.9 |
| 45-49 | 110,061,264 | 56,156,252 | 53,905,012 | 6.7 | 6.6 | 6.7 | 104.2 |
| 50-54 | 134,777,639 | 68,530,281 | 66,247,358 | 8.2 | 8.1 | 8.2 | 103.4 |
| 55-59 | 136,275,476 | 68,531,216 | 67,744,260 | 8.3 | 8.1 | 8.4 | 101.2 |
| 60-64 | 108,827,548 | 54,623,774 | 54,203,774 | 6.6 | 6.5 | 6.7 | 100.8 |
| 65-69 | 84,583,054 | 41,874,943 | 42,708,111 | 5.1 | 5 | 5.3 | 98 |
| 70-74 | 75,876,440 | 36,640,596 | 39,235,844 | 4.6 | 4.3 | 4.9 | 93.4 |
| 75-79 | 47,166,044 | 21,735,125 | 25,430,919 | 2.9 | 2.6 | 3.2 | 85.5 |
| 80-84 | 26,716,567 | 11,704,643 | 15,011,924 | 1.6 | 1.4 | 1.9 | 78 |
| 85-89 | 14,490,829 | 5,840,186 | 8,650,643 | 0.9 | 0.7 | 1.1 | 67.5 |
| 90-94 | 5,896,011 | 2,024,534 | 3,871,477 | 0.4 | 0.2 | 0.5 | 52.3 |
| 95-99 | 1,537,933 | 420,635 | 1,117,298 | 0.1 | 0 | 0.1 | 37.6 |
| 100+ | 237,246 | 48,091 | 189,155 | 0 | 0 | 0 | 25.4 |
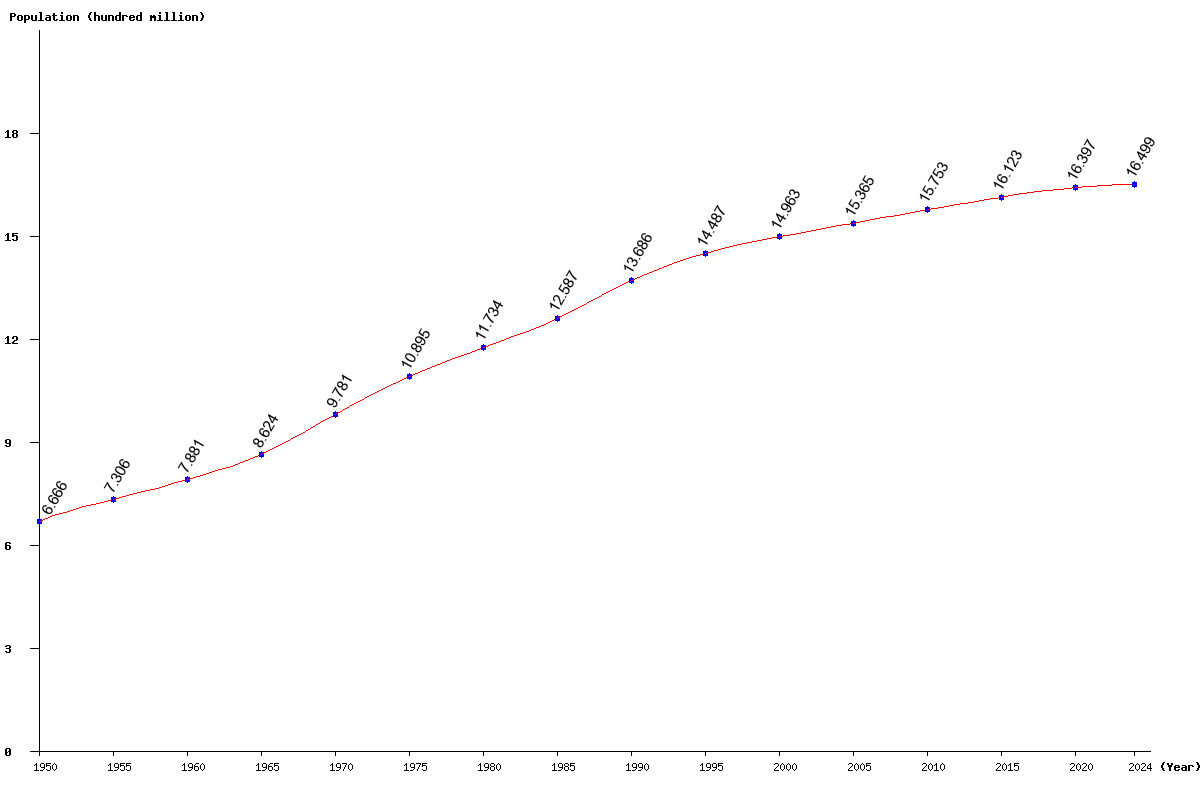
| Year | Population | Yearly % Change |
Yearly Change |
Sex ratio | Density (P/Km²) |
|---|---|---|---|---|---|
| 2025 | 1,651,107,935 | 0.07 | 1,159,728 | 104.69 | 142.82 |
| 2024 | 1,649,948,207 | 0.10 | 1,647,235 | 104.71 | 142.72 |
| 2023 | 1,648,300,972 | 0.13 | 2,207,111 | 104.72 | 142.58 |
| 2022 | 1,646,093,861 | 0.17 | 2,857,065 | 104.74 | 142.39 |
| 2021 | 1,643,236,796 | 0.22 | 3,563,791 | 104.74 | 142.14 |
| 2020 | 1,639,673,005 | 0.26 | 4,284,485 | 104.75 | 141.83 |
| 2019 | 1,635,388,520 | 0.30 | 4,963,732 | 104.75 | 141.46 |
| 2018 | 1,630,424,788 | 0.34 | 5,571,083 | 104.75 | 141.03 |
| 2017 | 1,624,853,705 | 0.38 | 6,075,980 | 104.74 | 140.55 |
| 2016 | 1,618,777,725 | 0.40 | 6,490,784 | 104.73 | 140.03 |
| 2015 | 1,612,286,941 | 0.43 | 6,879,127 | 104.71 | 139.47 |
| 2014 | 1,605,407,814 | 0.45 | 7,238,266 | 104.69 | 138.87 |
| 2013 | 1,598,169,548 | 0.47 | 7,499,565 | 104.66 | 138.24 |
| 2012 | 1,590,669,983 | 0.48 | 7,645,800 | 104.62 | 137.60 |
| 2011 | 1,583,024,183 | 0.49 | 7,703,839 | 104.59 | 136.93 |
| 2010 | 1,575,320,344 | 0.49 | 7,725,374 | 104.56 | 136.27 |
| 2005 | 1,536,539,691 | 2.69 | 40,255,665 | 104.47 | 132.91 |
| 2000 | 1,496,284,026 | 3.28 | 47,546,060 | 104.36 | 129.43 |
| 1995 | 1,448,737,966 | 5.86 | 80,146,032 | 104.37 | 125.32 |
| 1990 | 1,368,591,934 | 8.73 | 109,842,426 | 104.24 | 118.39 |
| 1985 | 1,258,749,508 | 7.28 | 85,377,432 | 104.07 | 108.88 |
| 1980 | 1,173,372,076 | 7.69 | 83,835,812 | 104.10 | 101.50 |
| 1975 | 1,089,536,264 | 11.39 | 111,423,357 | 104.02 | 94.25 |
| 1970 | 978,112,907 | 13.41 | 115,670,039 | 103.91 | 84.61 |
| 1965 | 862,442,868 | 9.43 | 74,297,696 | 104.11 | 74.60 |
| 1960 | 788,145,172 | 7.88 | 57,546,213 | 104.38 | 68.18 |
| 1955 | 730,598,959 | 9.60 | 64,013,168 | 104.94 | 63.20 |
| 1950 | 666,585,791 | 105.46 | 57.66 |