East Africa population
0
Births this year: 0
Births today 0
Deaths this year 0
Deaths today 0
0
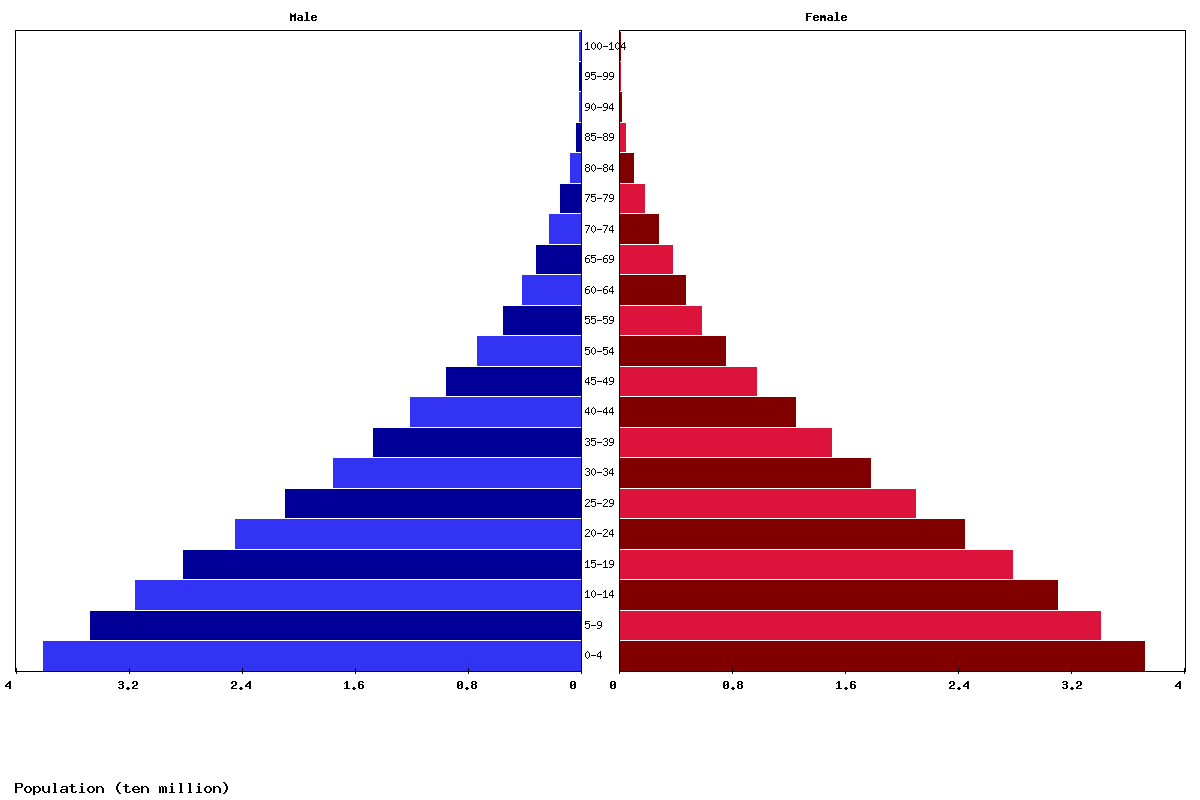
| Age | Both Sexes Population | Male Population | Female Population | Both Sexes (%) | Male (%) | Female (%) | Sex ratio (female/male) |
|---|---|---|---|---|---|---|---|
| Total | 512,820,553 | 255,331,241 | 257,489,312 | 100 | 100 | 100 | 99.2 |
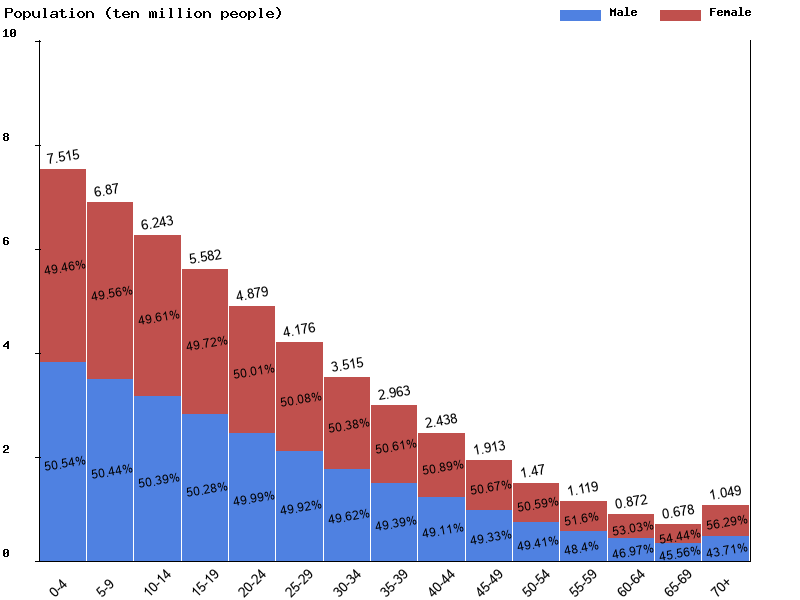
| 00-04 | 75,147,330 | 37,979,430 | 37,167,900 | 14.7 | 14.9 | 14.4 | 102.2 |
| 05-09 | 68,697,458 | 34,652,085 | 34,045,373 | 13.4 | 13.6 | 13.2 | 101.8 |
| 10-14 | 62,434,539 | 31,460,627 | 30,973,912 | 12.2 | 12.3 | 12 | 101.6 |
| 15-19 | 55,822,626 | 28,066,203 | 27,756,423 | 10.9 | 11 | 10.8 | 101.1 |
| 20-24 | 48,794,995 | 24,394,522 | 24,400,473 | 9.5 | 9.6 | 9.5 | 100 |
| 25-29 | 41,756,242 | 20,845,623 | 20,910,619 | 8.1 | 8.2 | 8.1 | 99.7 |
| 30-34 | 35,150,633 | 17,442,059 | 17,708,574 | 6.9 | 6.8 | 6.9 | 98.5 |
| 35-39 | 29,629,415 | 14,634,212 | 14,995,203 | 5.8 | 5.7 | 5.8 | 97.6 |
| 40-44 | 24,382,502 | 11,973,641 | 12,408,861 | 4.8 | 4.7 | 4.8 | 96.5 |
| 45-49 | 19,131,320 | 9,437,273 | 9,694,047 | 3.7 | 3.7 | 3.8 | 97.4 |
| 50-54 | 14,696,322 | 7,261,401 | 7,434,921 | 2.9 | 2.8 | 2.9 | 97.7 |
| 55-59 | 11,189,563 | 5,415,506 | 5,774,057 | 2.2 | 2.1 | 2.2 | 93.8 |
| 60-64 | 8,724,208 | 4,097,935 | 4,626,273 | 1.7 | 1.6 | 1.8 | 88.6 |
| 65-69 | 6,775,582 | 3,086,788 | 3,688,794 | 1.3 | 1.2 | 1.4 | 83.7 |
| 70-74 | 4,880,338 | 2,181,612 | 2,698,726 | 1 | 0.9 | 1 | 80.8 |
| 75-79 | 3,139,087 | 1,369,609 | 1,769,478 | 0.6 | 0.5 | 0.7 | 77.4 |
| 80-84 | 1,628,943 | 692,590 | 936,353 | 0.3 | 0.3 | 0.4 | 74 |
| 85-89 | 634,851 | 262,044 | 372,807 | 0.1 | 0.1 | 0.1 | 70.3 |
| 90-94 | 175,175 | 67,908 | 107,267 | 0 | 0 | 0 | 63.3 |
| 95-99 | 26,885 | 9,518 | 17,367 | 0 | 0 | 0 | 54.8 |
| 100+ | 2,539 | 655 | 1,884 | 0 | 0 | 0 | 34.8 |
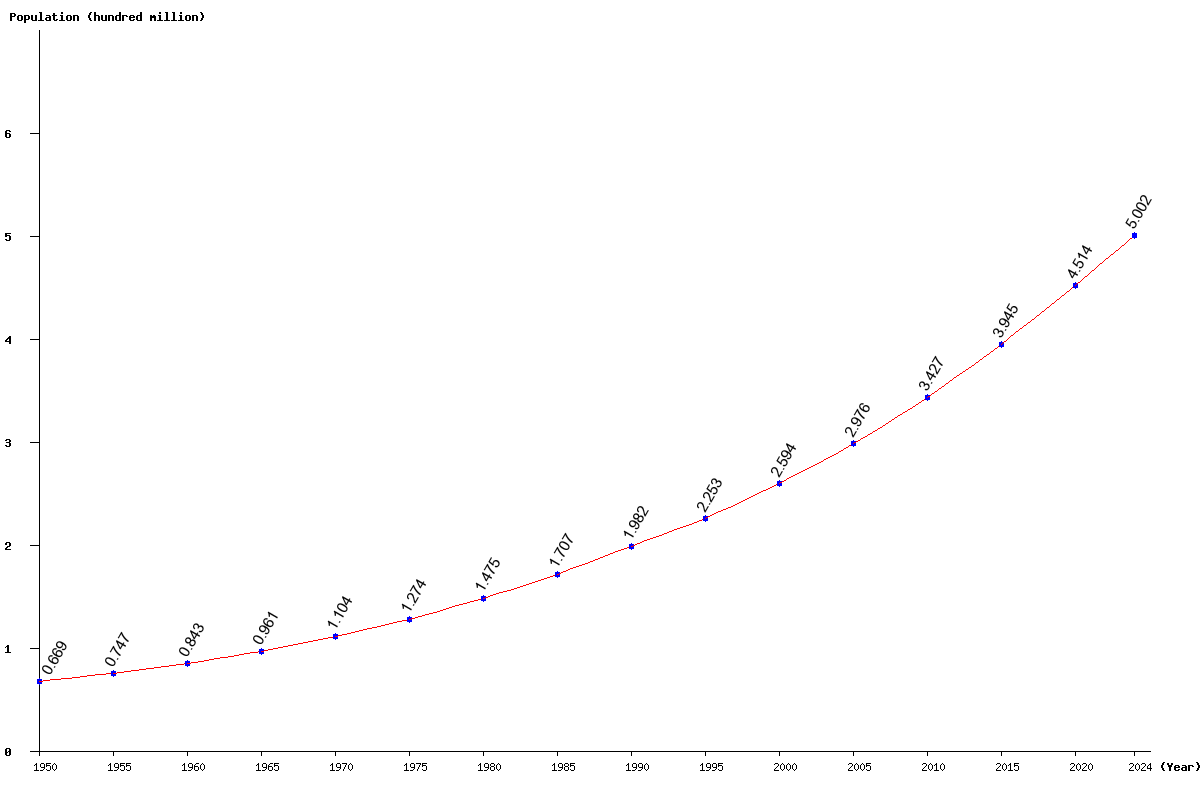
| Year | Population | Yearly % Change |
Yearly Change |
Sex ratio | Density (P/Km²) |
|---|---|---|---|---|---|
| 2025 | 512,820,553 | 2.53 | 12,650,327 | 99.16 | 76.91 |
| 2024 | 500,170,226 | 2.56 | 12,463,002 | 99.14 | 75.02 |
| 2023 | 487,707,224 | 2.58 | 12,279,967 | 99.12 | 73.15 |
| 2022 | 475,427,257 | 2.61 | 12,103,472 | 99.09 | 71.31 |
| 2021 | 463,323,785 | 2.64 | 11,930,629 | 99.07 | 69.49 |
| 2020 | 451,393,156 | 2.67 | 11,755,065 | 99.04 | 67.70 |
| 2019 | 439,638,091 | 2.70 | 11,573,600 | 99.01 | 65.94 |
| 2018 | 428,064,491 | 2.73 | 11,388,196 | 98.98 | 64.20 |
| 2017 | 416,676,295 | 2.76 | 11,197,827 | 98.95 | 62.49 |
| 2016 | 405,478,468 | 2.79 | 11,001,129 | 98.92 | 60.81 |
| 2015 | 394,477,339 | 2.82 | 10,801,979 | 98.89 | 59.16 |
| 2014 | 383,675,360 | 2.84 | 10,594,770 | 98.85 | 57.54 |
| 2013 | 373,080,590 | 2.86 | 10,368,583 | 98.82 | 55.96 |
| 2012 | 362,712,007 | 2.87 | 10,118,741 | 98.78 | 54.40 |
| 2011 | 352,593,266 | 2.87 | 9,850,641 | 98.74 | 52.88 |
| 2010 | 342,742,625 | 2.88 | 9,580,495 | 98.71 | 51.41 |
| 2005 | 297,636,467 | 14.75 | 38,263,926 | 98.54 | 44.64 |
| 2000 | 259,372,541 | 15.12 | 34,063,038 | 98.36 | 38.90 |
| 1995 | 225,309,503 | 13.66 | 27,077,816 | 98.11 | 33.79 |
| 1990 | 198,231,687 | 16.10 | 27,492,522 | 98.19 | 29.73 |
| 1985 | 170,739,165 | 15.75 | 23,227,482 | 98.29 | 25.61 |
| 1980 | 147,511,683 | 15.83 | 20,155,589 | 98.24 | 22.12 |
| 1975 | 127,356,094 | 15.33 | 16,927,727 | 98.22 | 19.10 |
| 1970 | 110,428,367 | 14.90 | 14,323,565 | 98.19 | 16.56 |
| 1965 | 96,104,802 | 14.00 | 11,799,356 | 98.17 | 14.41 |
| 1960 | 84,305,446 | 12.81 | 9,571,219 | 98.18 | 12.64 |
| 1955 | 74,734,227 | 11.67 | 7,811,525 | 98.21 | 11.21 |
| 1950 | 66,922,702 | 98.32 | 10.04 |