Croatia population
4,181,497
Births this year: 383,834
Births today 68
Deaths this year 516,044
Deaths today 92
4,181,497
| Region Name | Percents | Number |
|---|---|---|
| Roman Catholic | 86.3% | 3,722,729 people |
| Orthodox | 4.4% | 189,803 people |
| Muslim | 1.5% | 64,706 people |
| other | 1.5% | 64,706 people |
| unspecified | 2.5% | 107,843 people |
| not religious or atheist | 3.8% | 163,921 people |
| Ethnic groups Name | Percents | Number |
|---|---|---|
| Croat | 90.4% | 3,899,591 people |
| Serb | 4.4% | 189,803 people |
| other (including Bosniak, Hungarian, Slovene, Czech, and Roma) | 4.4% | 189,803 people |
| unspecified | 0.8% | 34,510 people |
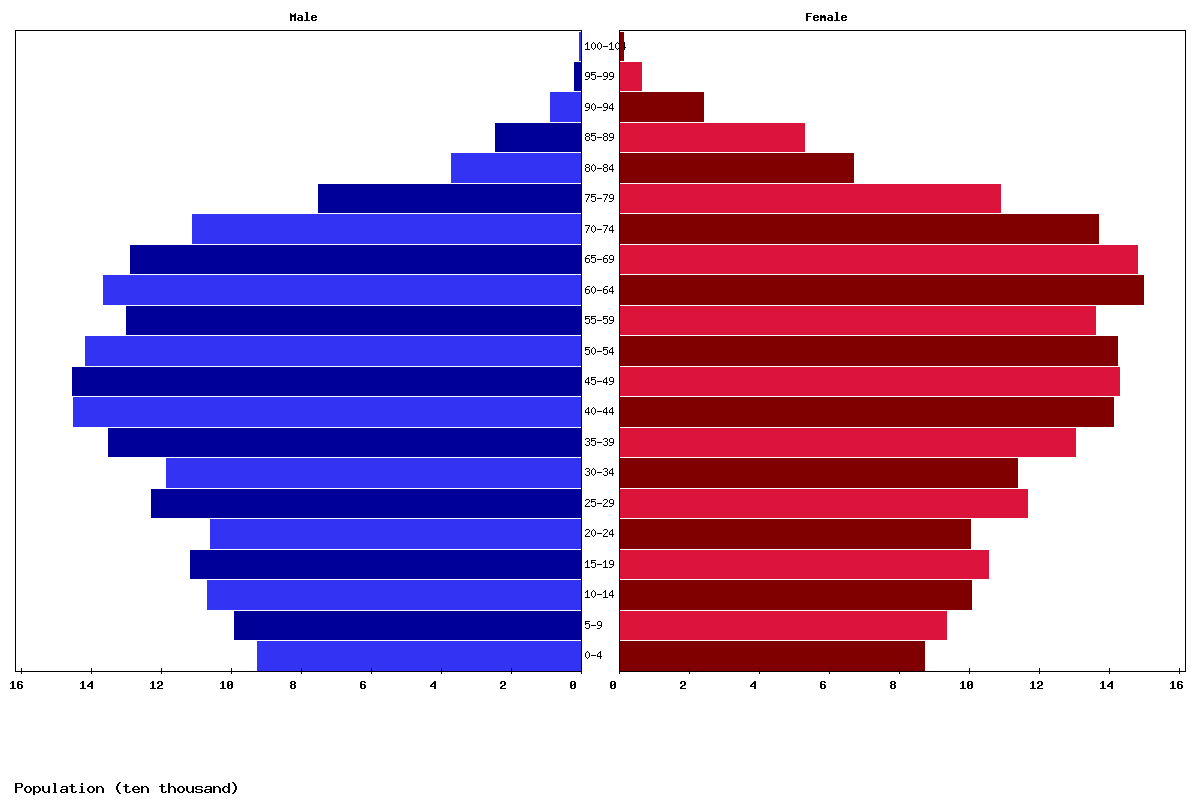
| Age | Both Sexes Population | Male Population | Female Population | Both Sexes (%) | Male (%) | Female (%) | Sex ratio (female/male) |
|---|---|---|---|---|---|---|---|
| Total | 4,072,414 | 1,970,858 | 2,101,556 | 100 | 100 | 100 | 93.8 |
| 00-04 | 179,254 | 92,174 | 87,080 | 4.4 | 4.7 | 4.1 | 105.8 |
| 05-09 | 191,729 | 98,574 | 93,155 | 4.7 | 5 | 4.4 | 105.8 |
| 10-14 | 206,854 | 106,316 | 100,538 | 5.1 | 5.4 | 4.8 | 105.7 |
| 15-19 | 216,701 | 111,347 | 105,354 | 5.3 | 5.6 | 5 | 105.7 |
| 20-24 | 205,649 | 105,546 | 100,103 | 5 | 5.4 | 4.8 | 105.4 |
| 25-29 | 238,918 | 122,395 | 116,523 | 5.9 | 6.2 | 5.5 | 105 |
| 30-34 | 231,845 | 118,275 | 113,570 | 5.7 | 6 | 5.4 | 104.1 |
| 35-39 | 264,846 | 134,603 | 130,243 | 6.5 | 6.8 | 6.2 | 103.3 |
| 40-44 | 285,634 | 144,762 | 140,872 | 7 | 7.3 | 6.7 | 102.8 |
| 45-49 | 287,569 | 144,916 | 142,653 | 7.1 | 7.4 | 6.8 | 101.6 |
| 50-54 | 283,492 | 141,209 | 142,283 | 7 | 7.2 | 6.8 | 99.2 |
| 55-59 | 265,679 | 129,714 | 135,965 | 6.5 | 6.6 | 6.5 | 95.4 |
| 60-64 | 285,661 | 136,161 | 149,500 | 7 | 6.9 | 7.1 | 91.1 |
| 65-69 | 276,343 | 128,380 | 147,963 | 6.8 | 6.5 | 7 | 86.8 |
| 70-74 | 247,181 | 110,590 | 136,591 | 6.1 | 5.6 | 6.5 | 81 |
| 75-79 | 183,568 | 74,718 | 108,850 | 4.5 | 3.8 | 5.2 | 68.6 |
| 80-84 | 103,603 | 36,820 | 66,783 | 2.5 | 1.9 | 3.2 | 55.1 |
| 85-89 | 76,842 | 24,002 | 52,840 | 1.9 | 1.2 | 2.5 | 45.4 |
| 90-94 | 32,231 | 8,501 | 23,730 | 0.8 | 0.4 | 1.1 | 35.8 |
| 95-99 | 7,741 | 1,679 | 6,062 | 0.2 | 0.1 | 0.3 | 27.7 |
| 100+ | 1,074 | 176 | 898 | 0 | 0 | 0 | 19.6 |
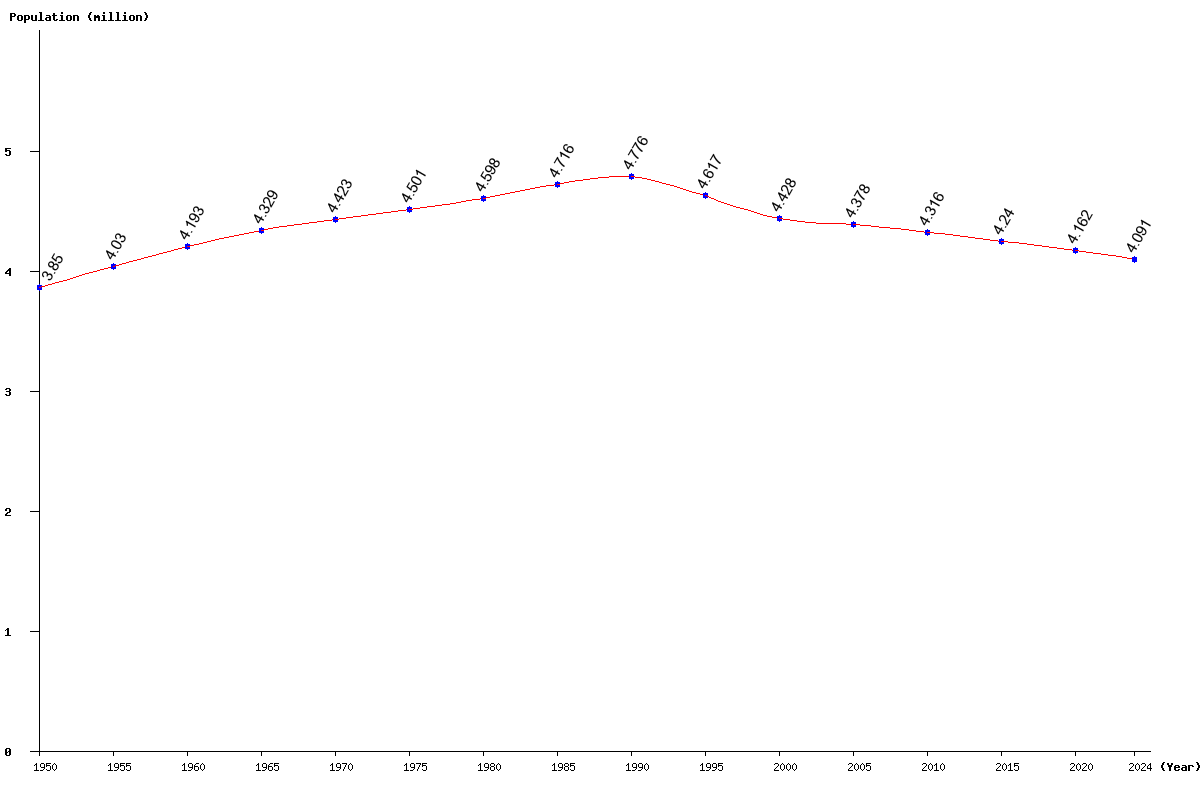
| Year | Population | Yearly % Change |
Yearly Change |
Sex ratio | Density (P/Km²) |
|---|---|---|---|---|---|
| 2025 | 4,072,414 | -0.46 | -18,674 | 93.78 | 72.77 |
| 2024 | 4,091,088 | -0.45 | -18,495 | 93.71 | 73.11 |
| 2023 | 4,109,583 | -0.44 | -18,180 | 93.65 | 73.44 |
| 2022 | 4,127,763 | -0.43 | -17,678 | 93.58 | 73.76 |
| 2021 | 4,145,441 | -0.41 | -17,058 | 93.52 | 74.08 |
| 2020 | 4,162,499 | -0.39 | -16,343 | 93.45 | 74.38 |
| 2019 | 4,178,842 | -0.37 | -15,696 | 93.39 | 74.68 |
| 2018 | 4,194,538 | -0.36 | -15,277 | 93.33 | 74.96 |
| 2017 | 4,209,815 | -0.36 | -15,186 | 93.27 | 75.23 |
| 2016 | 4,225,001 | -0.36 | -15,316 | 93.22 | 75.50 |
| 2015 | 4,240,317 | -0.37 | -15,536 | 93.17 | 75.77 |
| 2014 | 4,255,853 | -0.37 | -15,644 | 93.14 | 76.05 |
| 2013 | 4,271,497 | -0.36 | -15,518 | 93.12 | 76.33 |
| 2012 | 4,287,015 | -0.35 | -15,058 | 93.10 | 76.61 |
| 2011 | 4,302,073 | -0.33 | -14,352 | 93.08 | 76.88 |
| 2010 | 4,316,425 | -0.32 | -13,974 | 93.06 | 77.13 |
| 2005 | 4,378,056 | -1.13 | -50,013 | 92.90 | 78.24 |
| 2000 | 4,428,069 | -4.09 | -188,693 | 92.83 | 79.13 |
| 1995 | 4,616,762 | -3.34 | -159,612 | 93.69 | 82.50 |
| 1990 | 4,776,374 | 1.28 | 60,257 | 94.12 | 85.35 |
| 1985 | 4,716,117 | 2.57 | 117,991 | 93.78 | 84.28 |
| 1980 | 4,598,126 | 2.16 | 97,258 | 93.94 | 82.17 |
| 1975 | 4,500,868 | 1.76 | 77,795 | 94.06 | 80.43 |
| 1970 | 4,423,073 | 2.17 | 94,153 | 93.76 | 79.04 |
| 1965 | 4,328,920 | 3.25 | 136,286 | 93.33 | 77.36 |
| 1960 | 4,192,634 | 4.02 | 162,216 | 92.39 | 74.92 |
| 1955 | 4,030,418 | 4.68 | 180,123 | 91.87 | 72.02 |
| 1950 | 3,850,295 | 91.00 | 68.80 |