Chad population
11,635,176
Births this year: 0
Births today 0
Deaths this year 217,286
Deaths today 15
11,635,176
| Region Name | Percents | Number |
|---|---|---|
| Muslim | 53.1% | 6,293,657 people |
| Catholic | 20.1% | 2,382,345 people |
| Protestant | 14.2% | 1,683,050 people |
| animist | 7.3% | 865,230 people |
| other | 0.5% | 59,262 people |
| unknown | 1.7% | 201,492 people |
| atheist | 3.1% | 367,426 people |
| Ethnic groups Name | Percents | Number |
|---|---|---|
| Sara | 27.7% | 3,283,132 people |
| Arab | 12.3% | 1,457,853 people |
| Mayo-Kebbi | 11.5% | 1,363,033 people |
| Kanem-Bornou | 9% | 1,066,722 people |
| Ouaddai | 8.7% | 1,031,164 people |
| Hadjarai | 6.7% | 794,115 people |
| Tandjile | 6.5% | 770,410 people |
| Gorane | 6.3% | 746,705 people |
| Fitri-Batha | 4.7% | 557,066 people |
| other | 6.4% | 758,558 people |
| unknown | 0.3% | 35,557 people |
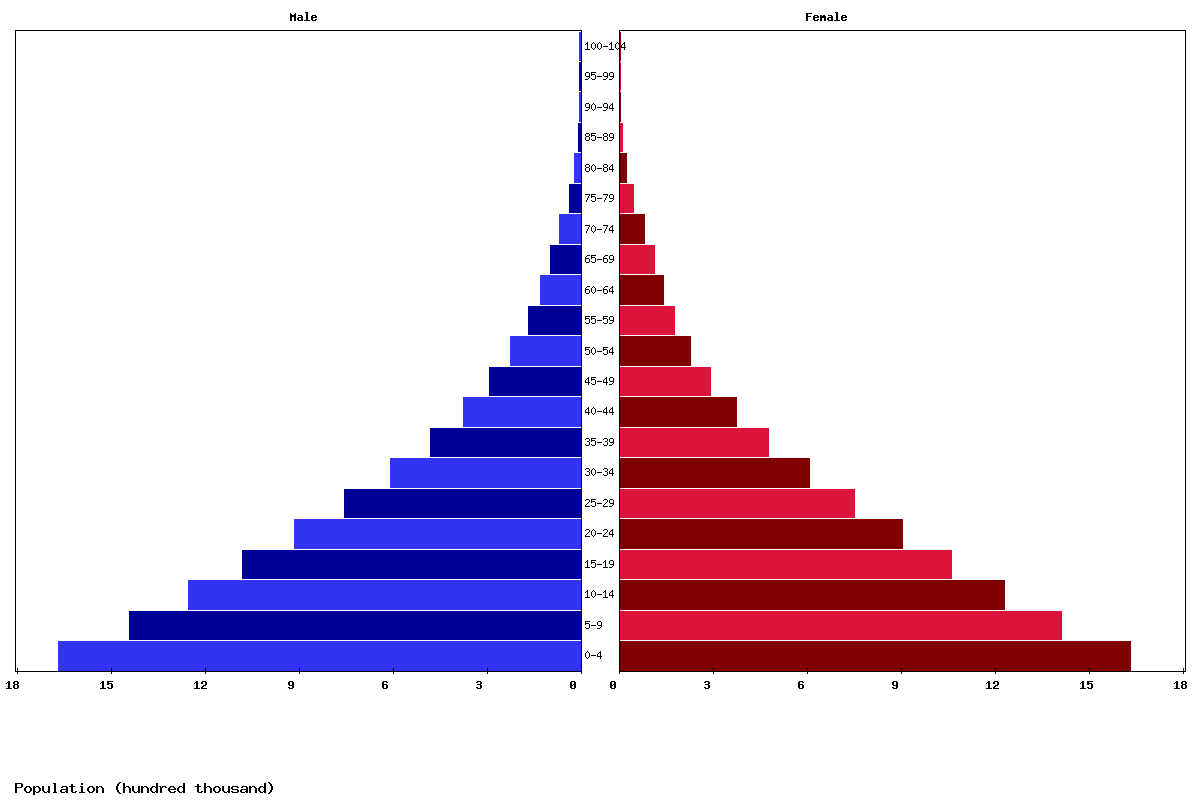
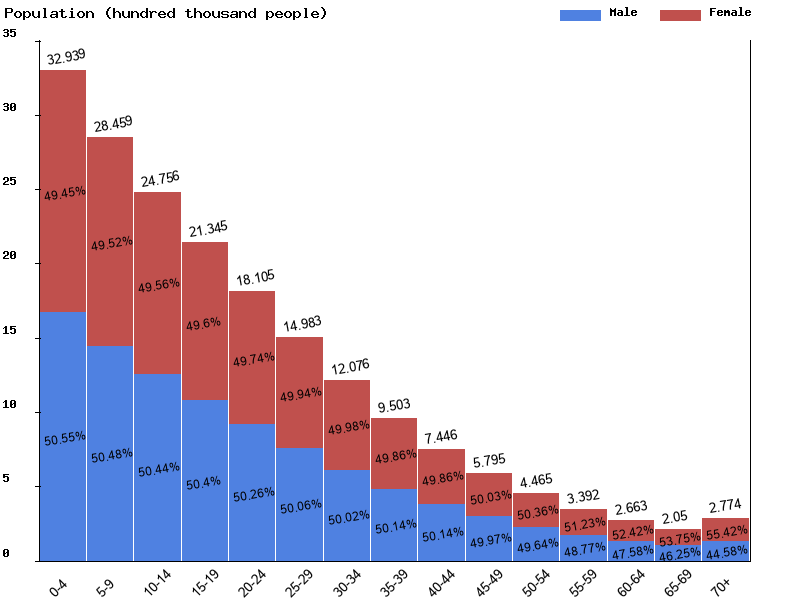
| Age | Both Sexes Population | Male Population | Female Population | Both Sexes (%) | Male (%) | Female (%) | Sex ratio (female/male) |
|---|---|---|---|---|---|---|---|
| Total | 19,074,752 | 9,561,705 | 9,513,047 | 100 | 100 | 100 | 100.5 |
| 00-04 | 3,293,856 | 1,664,980 | 1,628,876 | 17.3 | 17.4 | 17.1 | 102.2 |
| 05-09 | 2,845,877 | 1,436,673 | 1,409,204 | 14.9 | 15 | 14.8 | 101.9 |
| 10-14 | 2,475,583 | 1,248,750 | 1,226,833 | 13 | 13.1 | 12.9 | 101.8 |
| 15-19 | 2,134,491 | 1,075,697 | 1,058,794 | 11.2 | 11.3 | 11.1 | 101.6 |
| 20-24 | 1,810,472 | 910,028 | 900,444 | 9.5 | 9.5 | 9.5 | 101.1 |
| 25-29 | 1,498,270 | 750,059 | 748,211 | 7.9 | 7.8 | 7.9 | 100.2 |
| 30-34 | 1,207,551 | 604,032 | 603,519 | 6.3 | 6.3 | 6.3 | 100.1 |
| 35-39 | 950,285 | 476,449 | 473,836 | 5 | 5 | 5 | 100.6 |
| 40-44 | 744,551 | 373,300 | 371,251 | 3.9 | 3.9 | 3.9 | 100.6 |
| 45-49 | 579,461 | 289,540 | 289,921 | 3 | 3 | 3 | 99.9 |
| 50-54 | 446,455 | 221,602 | 224,853 | 2.3 | 2.3 | 2.4 | 98.6 |
| 55-59 | 339,243 | 165,437 | 173,806 | 1.8 | 1.7 | 1.8 | 95.2 |
| 60-64 | 266,316 | 126,705 | 139,611 | 1.4 | 1.3 | 1.5 | 90.8 |
| 65-69 | 204,960 | 94,802 | 110,158 | 1.1 | 1 | 1.2 | 86.1 |
| 70-74 | 144,365 | 64,830 | 79,535 | 0.8 | 0.7 | 0.8 | 81.5 |
| 75-79 | 77,274 | 34,989 | 42,285 | 0.4 | 0.4 | 0.4 | 82.7 |
| 80-84 | 38,554 | 16,965 | 21,589 | 0.2 | 0.2 | 0.2 | 78.6 |
| 85-89 | 13,648 | 5,621 | 8,027 | 0.1 | 0.1 | 0.1 | 70 |
| 90-94 | 3,098 | 1,118 | 1,980 | 0 | 0 | 0 | 56.5 |
| 95-99 | 410 | 121 | 289 | 0 | 0 | 0 | 41.9 |
| 100+ | 32 | 7 | 25 | 0 | 0 | 0 | 28 |
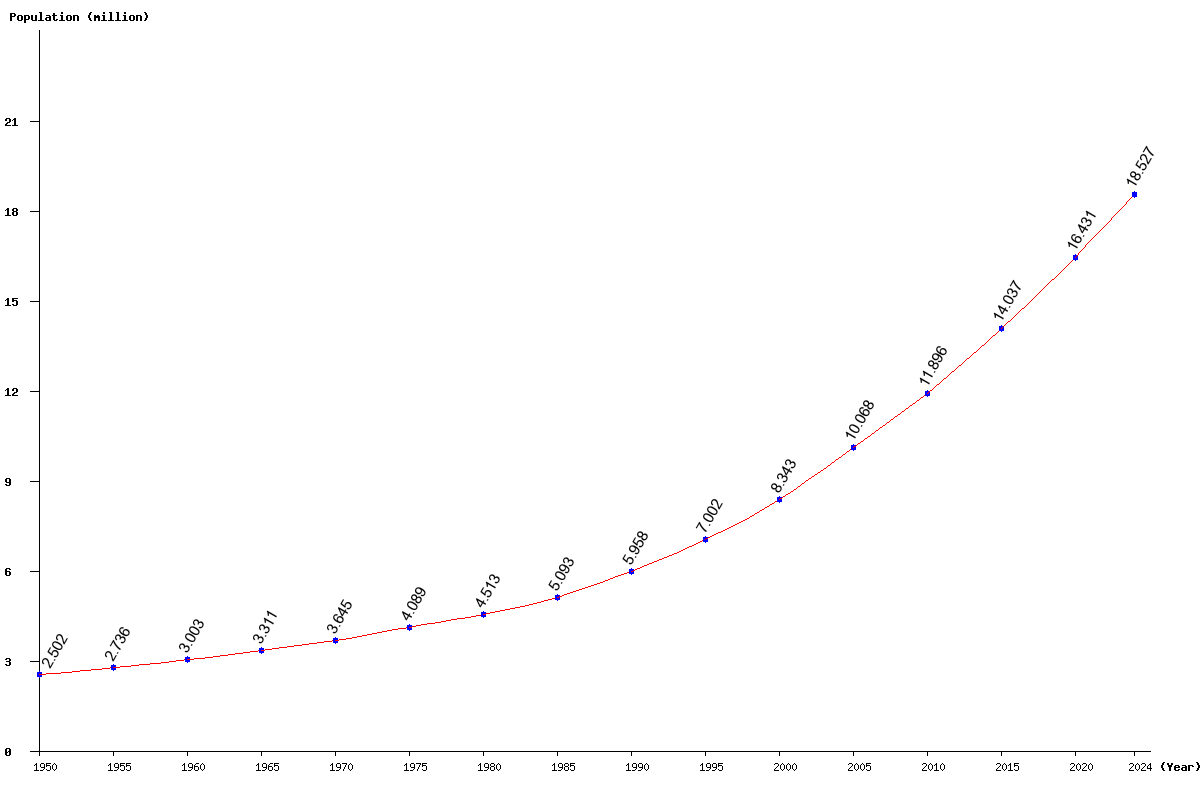
| Year | Population | Yearly % Change |
Yearly Change |
Sex ratio | Density (P/Km²) |
|---|---|---|---|---|---|
| 2025 | 19,074,752 | 2.96 | 547,839 | 100.51 | 15.15 |
| 2024 | 18,526,913 | 2.99 | 538,463 | 100.49 | 14.71 |
| 2023 | 17,988,450 | 3.03 | 528,873 | 100.47 | 14.29 |
| 2022 | 17,459,577 | 3.06 | 519,092 | 100.45 | 13.87 |
| 2021 | 16,940,485 | 3.10 | 509,153 | 100.43 | 13.45 |
| 2020 | 16,431,332 | 3.13 | 498,899 | 100.40 | 13.05 |
| 2019 | 15,932,433 | 3.16 | 488,528 | 100.37 | 12.65 |
| 2018 | 15,443,905 | 3.20 | 478,423 | 100.35 | 12.26 |
| 2017 | 14,965,482 | 3.23 | 468,743 | 100.32 | 11.88 |
| 2016 | 14,496,739 | 3.27 | 459,267 | 100.28 | 11.51 |
| 2015 | 14,037,472 | 3.32 | 450,419 | 100.25 | 11.15 |
| 2014 | 13,587,053 | 3.36 | 441,265 | 100.22 | 10.79 |
| 2013 | 13,145,788 | 3.38 | 430,323 | 100.18 | 10.44 |
| 2012 | 12,715,465 | 3.39 | 416,953 | 100.14 | 10.10 |
| 2011 | 12,298,512 | 3.38 | 402,132 | 100.10 | 9.77 |
| 2010 | 11,896,380 | 3.35 | 385,845 | 100.05 | 9.45 |
| 2005 | 10,067,932 | 20.67 | 1,724,611 | 99.66 | 8.00 |
| 2000 | 8,343,321 | 19.16 | 1,341,687 | 99.24 | 6.63 |
| 1995 | 7,001,634 | 17.52 | 1,043,612 | 98.94 | 5.56 |
| 1990 | 5,958,022 | 16.99 | 865,372 | 98.58 | 4.73 |
| 1985 | 5,092,650 | 12.85 | 579,855 | 98.02 | 4.04 |
| 1980 | 4,512,795 | 10.37 | 423,937 | 97.43 | 3.58 |
| 1975 | 4,088,858 | 12.18 | 443,947 | 96.69 | 3.25 |
| 1970 | 3,644,911 | 10.09 | 333,990 | 96.10 | 2.89 |
| 1965 | 3,310,921 | 10.27 | 308,325 | 95.61 | 2.63 |
| 1960 | 3,002,596 | 9.75 | 266,660 | 95.58 | 2.38 |
| 1955 | 2,735,936 | 9.34 | 233,622 | 96.10 | 2.17 |
| 1950 | 2,502,314 | 97.45 | 1.99 |