Central Asia population
0
Births this year: 0
Births today 0
Deaths this year 0
Deaths today 0
0
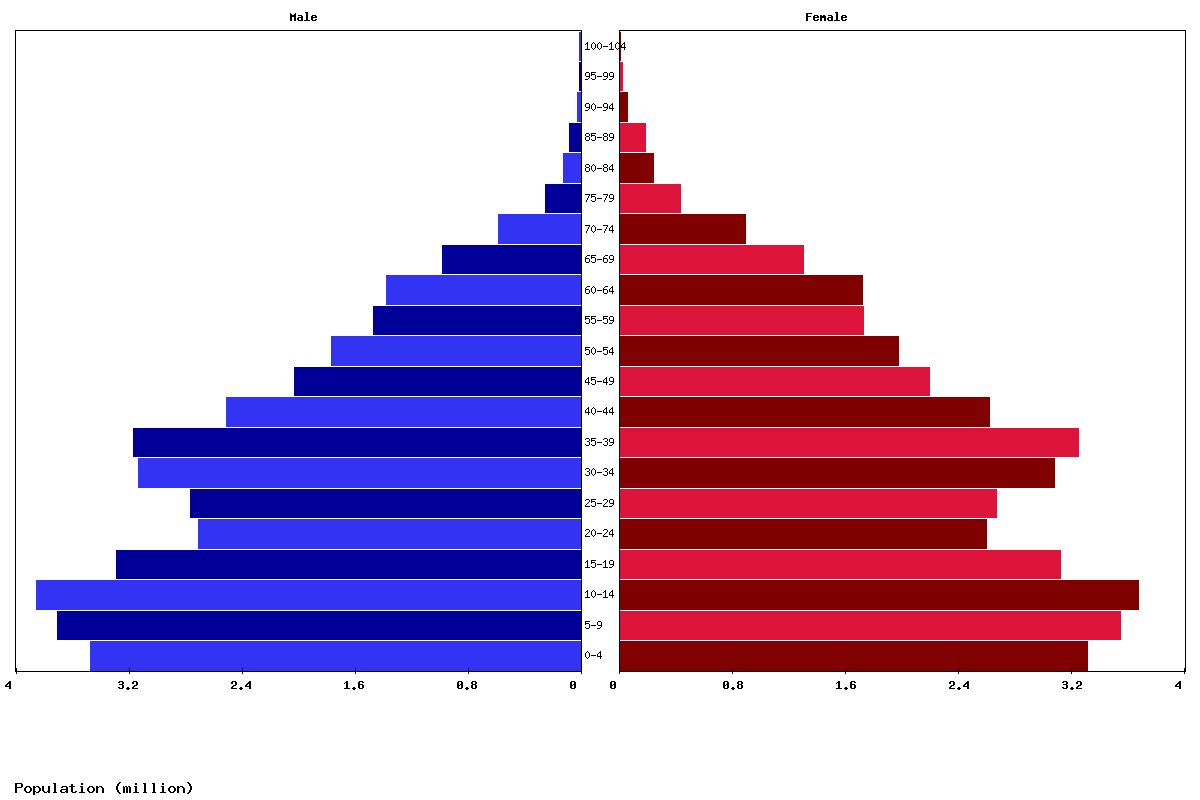
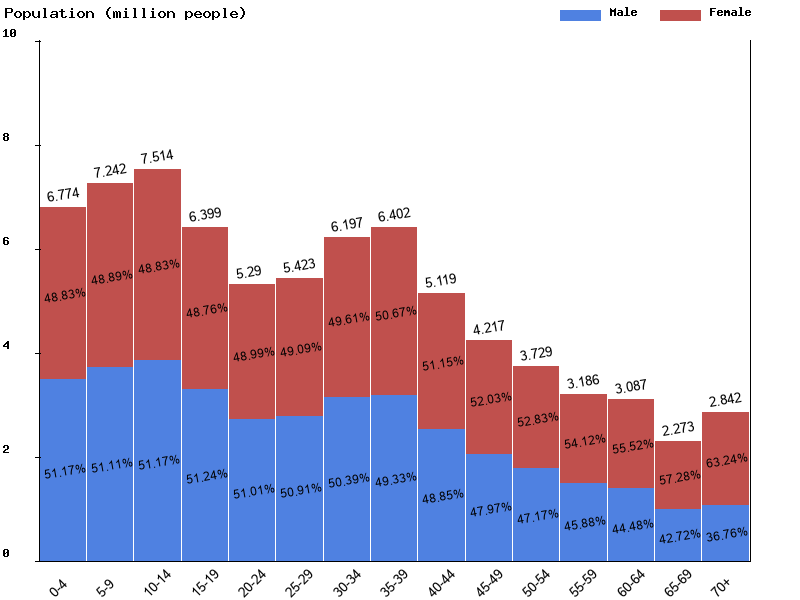
| Age | Both Sexes Population | Male Population | Female Population | Both Sexes (%) | Male (%) | Female (%) | Sex ratio (female/male) |
|---|---|---|---|---|---|---|---|
| Total | 75,691,804 | 37,162,640 | 38,529,164 | 100 | 100 | 100 | 96.5 |
| 00-04 | 6,773,665 | 3,465,771 | 3,307,894 | 8.9 | 9.3 | 8.6 | 104.8 |
| 05-09 | 7,241,779 | 3,701,239 | 3,540,540 | 9.6 | 10 | 9.2 | 104.5 |
| 10-14 | 7,513,951 | 3,844,818 | 3,669,133 | 9.9 | 10.3 | 9.5 | 104.8 |
| 15-19 | 6,398,647 | 3,278,837 | 3,119,810 | 8.5 | 8.8 | 8.1 | 105.1 |
| 20-24 | 5,289,805 | 2,698,261 | 2,591,544 | 7 | 7.3 | 6.7 | 104.1 |
| 25-29 | 5,423,000 | 2,760,956 | 2,662,044 | 7.2 | 7.4 | 6.9 | 103.7 |
| 30-34 | 6,196,546 | 3,122,213 | 3,074,333 | 8.2 | 8.4 | 8 | 101.6 |
| 35-39 | 6,401,903 | 3,157,763 | 3,244,140 | 8.5 | 8.5 | 8.4 | 97.3 |
| 40-44 | 5,118,533 | 2,500,651 | 2,617,882 | 6.8 | 6.7 | 6.8 | 95.5 |
| 45-49 | 4,216,568 | 2,022,550 | 2,194,018 | 5.6 | 5.4 | 5.7 | 92.2 |
| 50-54 | 3,729,325 | 1,759,053 | 1,970,272 | 4.9 | 4.7 | 5.1 | 89.3 |
| 55-59 | 3,185,679 | 1,461,614 | 1,724,065 | 4.2 | 3.9 | 4.5 | 84.8 |
| 60-64 | 3,087,463 | 1,373,250 | 1,714,213 | 4.1 | 3.7 | 4.4 | 80.1 |
| 65-69 | 2,272,684 | 970,982 | 1,301,702 | 3 | 2.6 | 3.4 | 74.6 |
| 70-74 | 1,463,945 | 576,733 | 887,212 | 1.9 | 1.6 | 2.3 | 65 |
| 75-79 | 676,250 | 247,178 | 429,072 | 0.9 | 0.7 | 1.1 | 57.6 |
| 80-84 | 352,975 | 118,767 | 234,208 | 0.5 | 0.3 | 0.6 | 50.7 |
| 85-89 | 253,436 | 75,927 | 177,509 | 0.3 | 0.2 | 0.5 | 42.8 |
| 90-94 | 71,848 | 20,454 | 51,394 | 0.1 | 0.1 | 0.1 | 39.8 |
| 95-99 | 20,644 | 5,080 | 15,564 | 0 | 0 | 0 | 32.6 |
| 100+ | 3,158 | 543 | 2,615 | 0 | 0 | 0 | 20.8 |
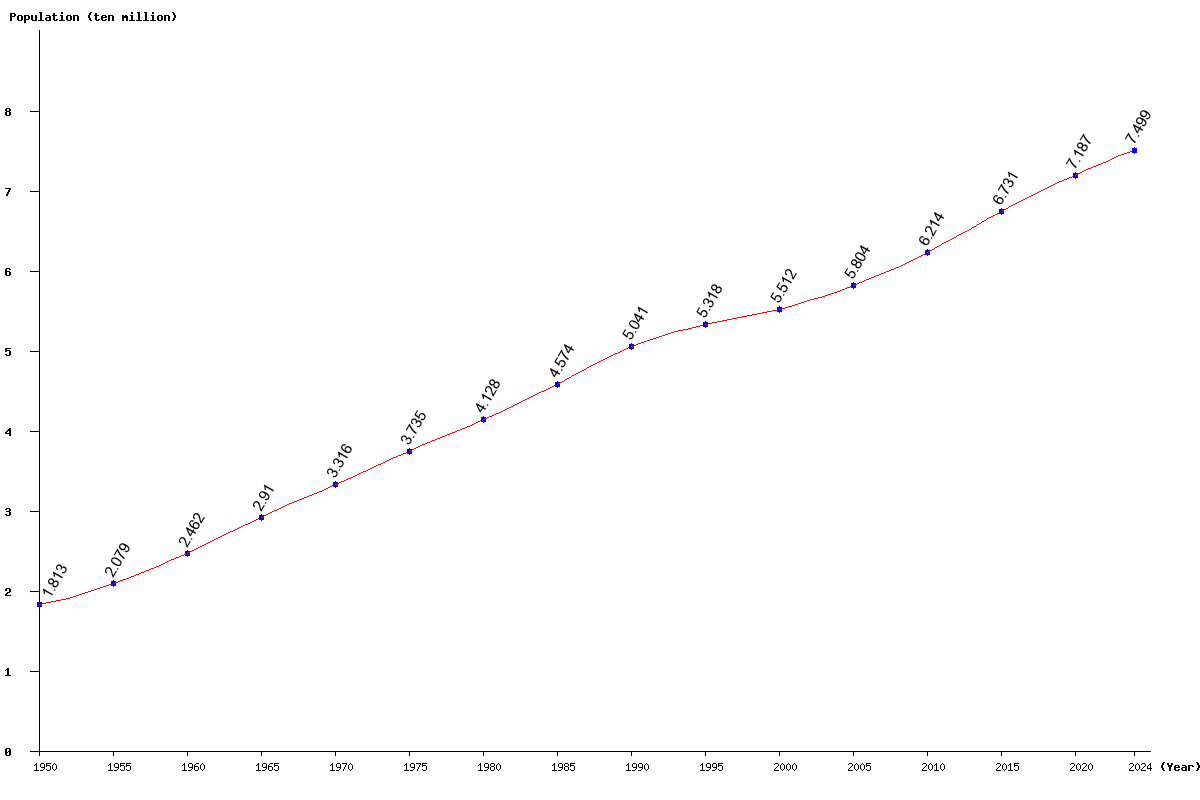
| Year | Population | Yearly % Change |
Yearly Change |
Sex ratio | Density (P/Km²) |
|---|---|---|---|---|---|
| 2025 | 75,691,804 | 0.94 | 703,765 | 96.45 | 19.28 |
| 2024 | 74,988,039 | 0.99 | 733,773 | 96.50 | 19.10 |
| 2023 | 74,254,266 | 1.04 | 764,172 | 96.54 | 18.91 |
| 2022 | 73,490,094 | 1.09 | 794,320 | 96.57 | 18.72 |
| 2021 | 72,695,774 | 1.15 | 824,127 | 96.61 | 18.51 |
| 2020 | 71,871,647 | 1.20 | 850,076 | 96.63 | 18.30 |
| 2019 | 71,021,571 | 1.25 | 875,088 | 96.66 | 18.09 |
| 2018 | 70,146,483 | 1.31 | 905,453 | 96.68 | 17.86 |
| 2017 | 69,241,030 | 1.38 | 943,297 | 96.69 | 17.63 |
| 2016 | 68,297,733 | 1.46 | 983,700 | 96.69 | 17.39 |
| 2015 | 67,314,033 | 1.55 | 1,025,854 | 96.68 | 17.14 |
| 2014 | 66,288,179 | 1.62 | 1,057,592 | 96.64 | 16.88 |
| 2013 | 65,230,587 | 1.66 | 1,064,581 | 96.58 | 16.61 |
| 2012 | 64,166,006 | 1.65 | 1,038,882 | 96.52 | 16.34 |
| 2011 | 63,127,124 | 1.59 | 988,478 | 96.46 | 16.08 |
| 2010 | 62,138,646 | 1.52 | 927,951 | 96.42 | 15.82 |
| 2005 | 58,042,955 | 5.31 | 2,925,543 | 96.44 | 14.78 |
| 2000 | 55,117,412 | 3.65 | 1,939,568 | 96.60 | 14.04 |
| 1995 | 53,177,844 | 5.50 | 2,772,781 | 96.91 | 13.54 |
| 1990 | 50,405,063 | 10.20 | 4,667,233 | 96.33 | 12.84 |
| 1985 | 45,737,830 | 10.81 | 4,460,799 | 95.75 | 11.65 |
| 1980 | 41,277,031 | 10.52 | 3,928,206 | 95.21 | 10.51 |
| 1975 | 37,348,825 | 12.65 | 4,193,255 | 95.04 | 9.51 |
| 1970 | 33,155,570 | 13.95 | 4,059,925 | 94.13 | 8.44 |
| 1965 | 29,095,645 | 18.20 | 4,480,120 | 93.80 | 7.41 |
| 1960 | 24,615,525 | 18.38 | 3,822,438 | 93.12 | 6.27 |
| 1955 | 20,793,087 | 14.68 | 2,662,192 | 92.90 | 5.30 |
| 1950 | 18,130,895 | 93.68 | 4.62 |