Central African Republic population
539,227
Births this year: 0
Births today 0
Deaths this year 11,498
Deaths today 2
539,227
| Region Name | Percents | Number |
|---|---|---|
| indigenous beliefs | 35% | 192,754 people |
| Protestant | 25% | 137,681 people |
| Roman Catholic | 25% | 137,681 people |
| Muslim | 15% | 82,609 people |
| Ethnic groups Name | Percents | Number |
|---|---|---|
| Baya | 33% | 181,739 people |
| Banda | 27% | 148,696 people |
| Mandjia | 13% | 71,594 people |
| Sara | 10% | 55,073 people |
| Mboum 7, other 10 | 710% | 3,910,148 people |
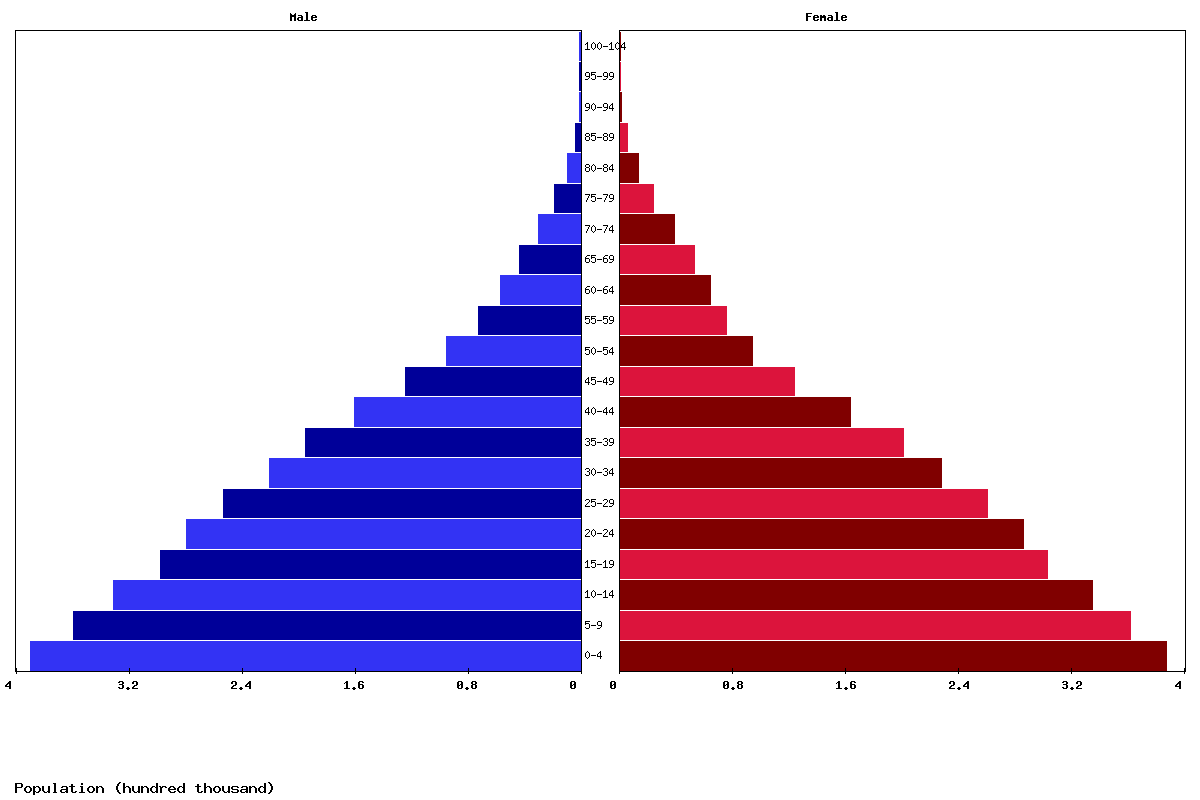
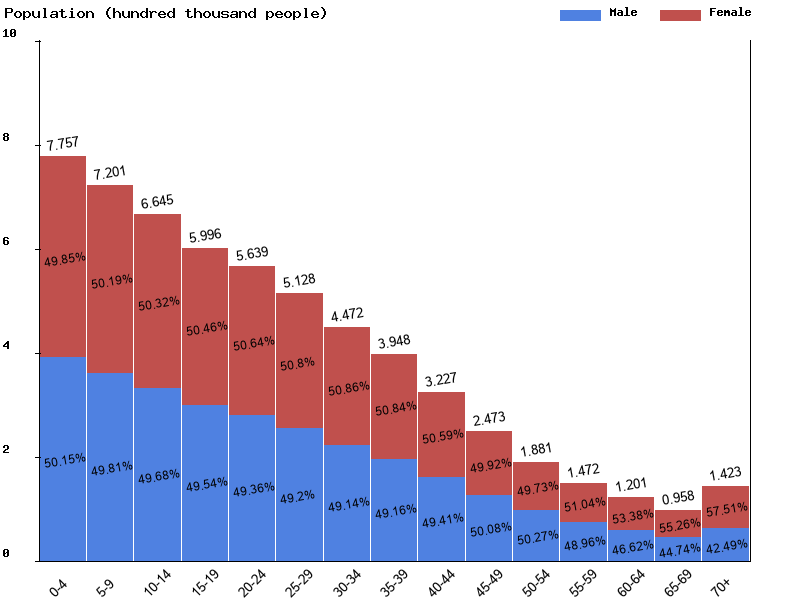
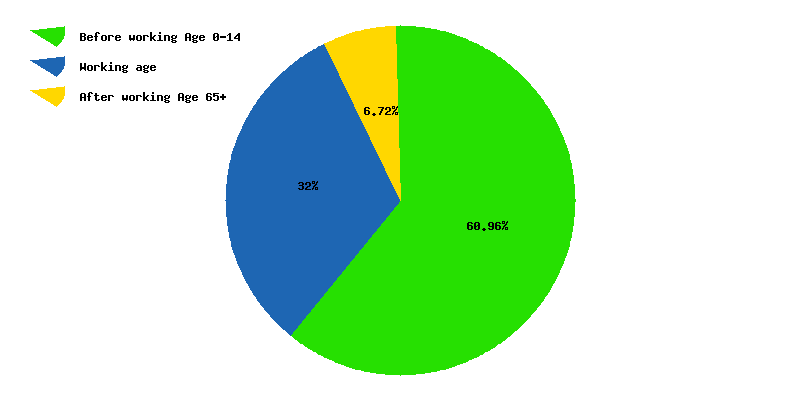
| Age | Both Sexes Population | Male Population | Female Population | Both Sexes (%) | Male (%) | Female (%) | Sex ratio (female/male) |
|---|---|---|---|---|---|---|---|
| Total | 5,941,978 | 2,928,563 | 3,013,415 | 100 | 100 | 100 | 97.2 |
| 00-04 | 775,654 | 388,984 | 386,670 | 13.1 | 13.3 | 12.8 | 100.6 |
| 05-09 | 720,095 | 358,671 | 361,424 | 12.1 | 12.2 | 12 | 99.2 |
| 10-14 | 664,488 | 330,149 | 334,339 | 11.2 | 11.3 | 11.1 | 98.7 |
| 15-19 | 599,562 | 297,049 | 302,513 | 10.1 | 10.1 | 10 | 98.2 |
| 20-24 | 563,885 | 278,313 | 285,572 | 9.5 | 9.5 | 9.5 | 97.5 |
| 25-29 | 512,838 | 252,330 | 260,508 | 8.6 | 8.6 | 8.6 | 96.9 |
| 30-34 | 447,235 | 219,783 | 227,452 | 7.5 | 7.5 | 7.5 | 96.6 |
| 35-39 | 394,800 | 194,088 | 200,712 | 6.6 | 6.6 | 6.7 | 96.7 |
| 40-44 | 322,681 | 159,449 | 163,232 | 5.4 | 5.4 | 5.4 | 97.7 |
| 45-49 | 247,260 | 123,820 | 123,440 | 4.2 | 4.2 | 4.1 | 100.3 |
| 50-54 | 188,123 | 94,577 | 93,546 | 3.2 | 3.2 | 3.1 | 101.1 |
| 55-59 | 147,233 | 72,079 | 75,154 | 2.5 | 2.5 | 2.5 | 95.9 |
| 60-64 | 120,065 | 55,971 | 64,094 | 2 | 1.9 | 2.1 | 87.3 |
| 65-69 | 95,799 | 42,858 | 52,941 | 1.6 | 1.5 | 1.8 | 81 |
| 70-74 | 67,983 | 29,704 | 38,279 | 1.1 | 1 | 1.3 | 77.6 |
| 75-79 | 41,770 | 17,885 | 23,885 | 0.7 | 0.6 | 0.8 | 74.9 |
| 80-84 | 22,007 | 8,999 | 13,008 | 0.4 | 0.3 | 0.4 | 69.2 |
| 85-89 | 8,219 | 3,115 | 5,104 | 0.1 | 0.1 | 0.2 | 61 |
| 90-94 | 1,981 | 660 | 1,321 | 0 | 0 | 0 | 50 |
| 95-99 | 278 | 75 | 203 | 0 | 0 | 0 | 36.9 |
| 100+ | 22 | 4 | 18 | 0 | 0 | 0 | 22.2 |
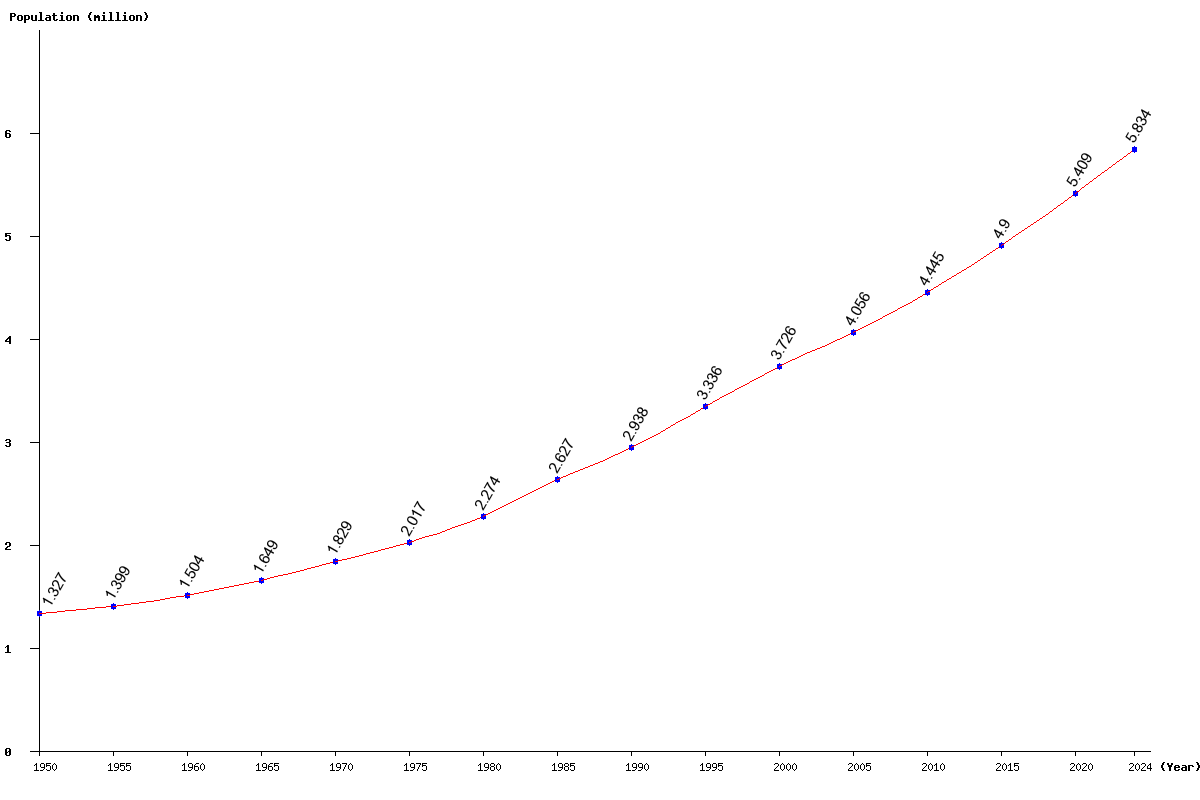
| Year | Population | Yearly % Change |
Yearly Change |
Sex ratio | Density (P/Km²) |
|---|---|---|---|---|---|
| 2025 | 5,941,978 | 1.85 | 108,012 | 97.18 | 9.54 |
| 2024 | 5,833,966 | 1.87 | 107,349 | 97.19 | 9.36 |
| 2023 | 5,726,617 | 1.90 | 106,667 | 97.20 | 9.19 |
| 2022 | 5,619,950 | 1.92 | 105,973 | 97.20 | 9.02 |
| 2021 | 5,513,977 | 1.95 | 105,219 | 97.21 | 8.85 |
| 2020 | 5,408,758 | 1.97 | 104,411 | 97.21 | 8.68 |
| 2019 | 5,304,347 | 1.99 | 103,426 | 97.21 | 8.51 |
| 2018 | 5,200,921 | 2.00 | 102,095 | 97.22 | 8.35 |
| 2017 | 5,098,826 | 2.01 | 100,333 | 97.22 | 8.18 |
| 2016 | 4,998,493 | 2.00 | 98,219 | 97.22 | 8.02 |
| 2015 | 4,900,274 | 2.00 | 95,958 | 97.21 | 7.87 |
| 2014 | 4,804,316 | 1.99 | 93,638 | 97.19 | 7.71 |
| 2013 | 4,710,678 | 1.97 | 91,178 | 97.16 | 7.56 |
| 2012 | 4,619,500 | 1.96 | 88,597 | 97.13 | 7.42 |
| 2011 | 4,530,903 | 1.93 | 85,930 | 97.09 | 7.27 |
| 2010 | 4,444,973 | 1.91 | 83,481 | 97.05 | 7.14 |
| 2005 | 4,055,608 | 8.84 | 329,560 | 96.84 | 6.51 |
| 2000 | 3,726,048 | 11.70 | 390,208 | 96.61 | 5.98 |
| 1995 | 3,335,840 | 13.55 | 398,008 | 96.48 | 5.35 |
| 1990 | 2,937,832 | 11.81 | 310,408 | 96.47 | 4.72 |
| 1985 | 2,627,424 | 15.54 | 353,329 | 96.58 | 4.22 |
| 1980 | 2,274,095 | 12.73 | 256,716 | 96.58 | 3.65 |
| 1975 | 2,017,379 | 10.32 | 188,669 | 96.55 | 3.24 |
| 1970 | 1,828,710 | 10.91 | 179,880 | 96.62 | 2.94 |
| 1965 | 1,648,830 | 9.67 | 145,329 | 96.66 | 2.65 |
| 1960 | 1,503,501 | 7.43 | 104,008 | 96.76 | 2.41 |
| 1955 | 1,399,493 | 5.49 | 72,840 | 96.94 | 2.25 |
| 1950 | 1,326,653 | 97.22 | 2.13 |