Austria population
8,711,770
Births this year: 818,200
Births today 105
Deaths this year 818,200
Deaths today 105
8,711,770
| Region Name | Percents | Number |
|---|---|---|
| Roman Catholic | 73.6% | 6,411,863 people |
| Protestant | 4.7% | 409,453 people |
| Muslim | 4.2% | 365,894 people |
| other | 3.5% | 304,912 people |
| unspecified | 2% | 174,235 people |
| none | 12% | 1,045,412 people |
| Ethnic groups Name | Percents | Number |
|---|---|---|
| Austrians | 91.1% | 7,936,422 people |
| former Yugoslavs (includes Croatians, Slovenes, Serbs, and Bosniaks) | 4% | 348,471 people |
| Turks | 1.6% | 139,388 people |
| German | 0.9% | 78,406 people |
| other or unspecified | 2.4% | 209,082 people |
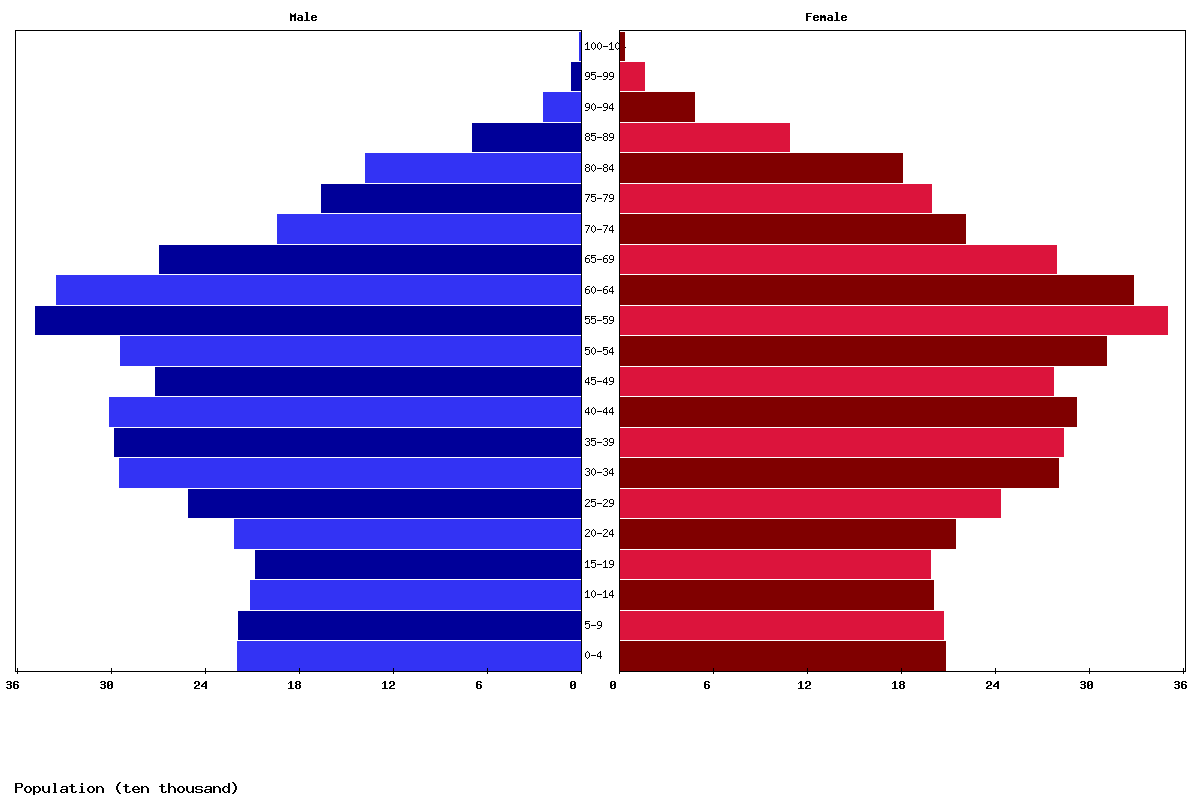
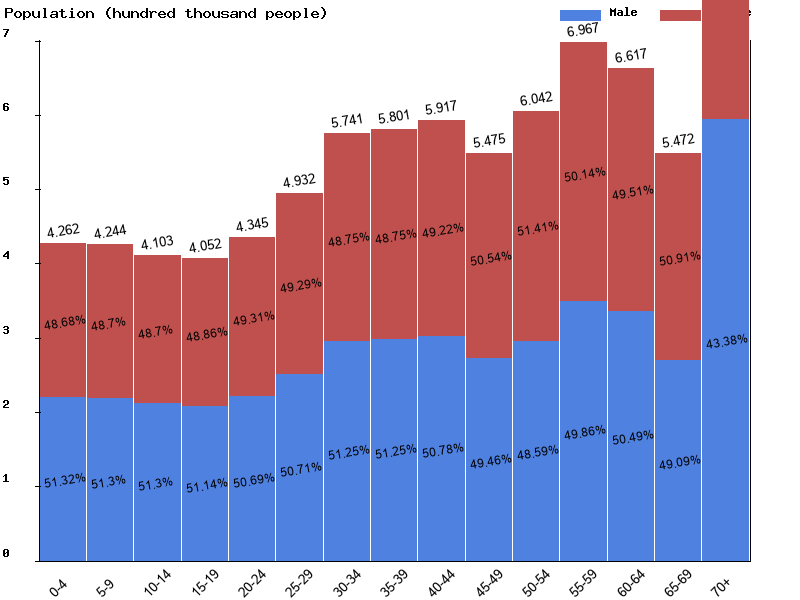
| Age | Both Sexes Population | Male Population | Female Population | Both Sexes (%) | Male (%) | Female (%) | Sex ratio (female/male) |
|---|---|---|---|---|---|---|---|
| Total | 8,762,992 | 4,323,367 | 4,439,625 | 100 | 100 | 100 | 97.4 |
| 00-04 | 426,168 | 218,708 | 207,460 | 4.9 | 5.1 | 4.7 | 105.4 |
| 05-09 | 424,392 | 217,708 | 206,684 | 4.8 | 5 | 4.7 | 105.3 |
| 10-14 | 410,326 | 210,478 | 199,848 | 4.7 | 4.9 | 4.5 | 105.3 |
| 15-19 | 405,193 | 207,207 | 197,986 | 4.6 | 4.8 | 4.5 | 104.7 |
| 20-24 | 434,476 | 220,215 | 214,261 | 5 | 5.1 | 4.8 | 102.8 |
| 25-29 | 493,240 | 250,143 | 243,097 | 5.6 | 5.8 | 5.5 | 102.9 |
| 30-34 | 574,075 | 294,196 | 279,879 | 6.6 | 6.8 | 6.3 | 105.1 |
| 35-39 | 580,144 | 297,314 | 282,830 | 6.6 | 6.9 | 6.4 | 105.1 |
| 40-44 | 591,678 | 300,477 | 291,201 | 6.8 | 7 | 6.6 | 103.2 |
| 45-49 | 547,523 | 270,806 | 276,717 | 6.2 | 6.3 | 6.2 | 97.9 |
| 50-54 | 604,173 | 293,546 | 310,627 | 6.9 | 6.8 | 7 | 94.5 |
| 55-59 | 696,698 | 347,392 | 349,306 | 8 | 8 | 7.9 | 99.5 |
| 60-64 | 661,719 | 334,079 | 327,640 | 7.6 | 7.7 | 7.4 | 102 |
| 65-69 | 547,181 | 268,584 | 278,597 | 6.2 | 6.2 | 6.3 | 96.4 |
| 70-74 | 413,359 | 192,884 | 220,475 | 4.7 | 4.5 | 5 | 87.5 |
| 75-79 | 363,601 | 164,715 | 198,886 | 4.1 | 3.8 | 4.5 | 82.8 |
| 80-84 | 317,251 | 137,168 | 180,083 | 3.6 | 3.2 | 4.1 | 76.2 |
| 85-89 | 177,021 | 68,769 | 108,252 | 2 | 1.6 | 2.4 | 63.5 |
| 90-94 | 70,680 | 23,302 | 47,378 | 0.8 | 0.5 | 1.1 | 49.2 |
| 95-99 | 20,953 | 5,180 | 15,773 | 0.2 | 0.1 | 0.4 | 32.8 |
| 100+ | 3,141 | 496 | 2,645 | 0 | 0 | 0.1 | 18.8 |
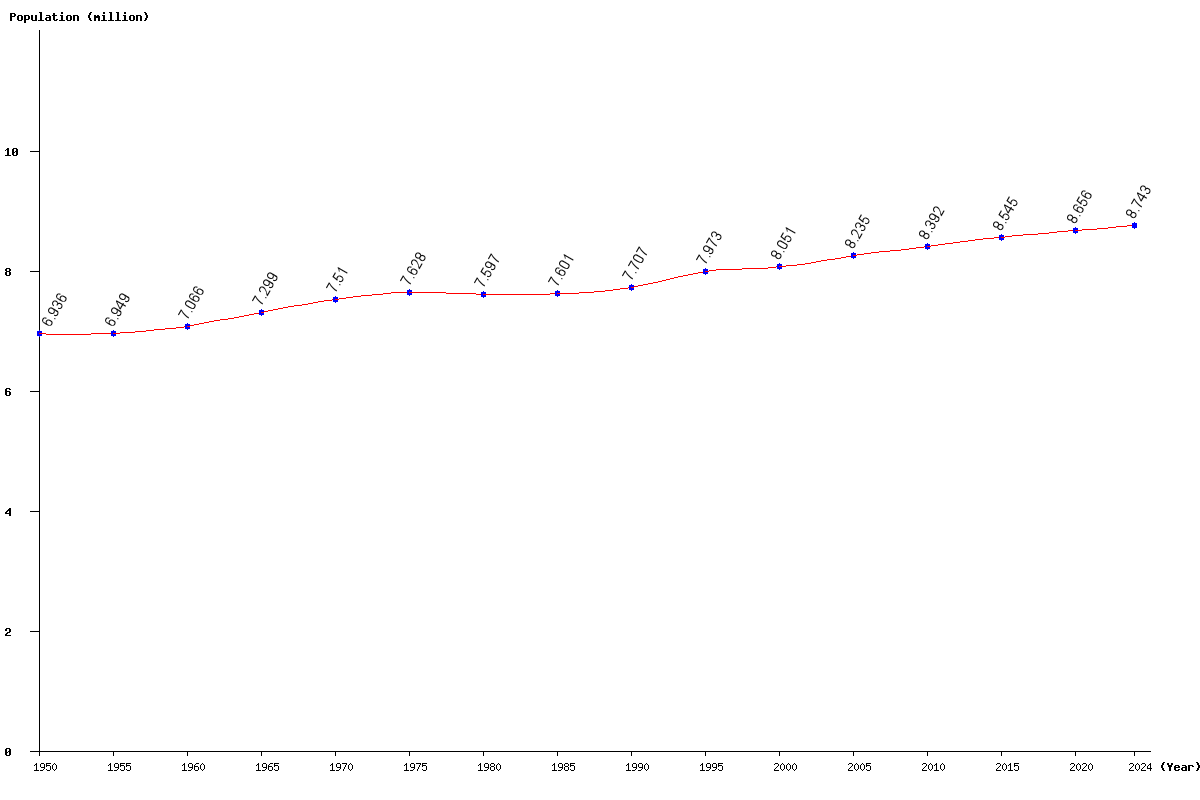
| Year | Population | Yearly % Change |
Yearly Change |
Sex ratio | Density (P/Km²) |
|---|---|---|---|---|---|
| 2025 | 8,762,992 | 0.23 | 20,147 | 97.38 | 106.34 |
| 2024 | 8,742,845 | 0.24 | 21,294 | 97.32 | 106.09 |
| 2023 | 8,721,551 | 0.25 | 21,981 | 97.25 | 105.83 |
| 2022 | 8,699,570 | 0.25 | 22,079 | 97.17 | 105.57 |
| 2021 | 8,677,491 | 0.25 | 21,798 | 97.09 | 105.30 |
| 2020 | 8,655,693 | 0.25 | 21,210 | 97.02 | 105.03 |
| 2019 | 8,634,483 | 0.24 | 20,836 | 96.95 | 104.78 |
| 2018 | 8,613,647 | 0.25 | 21,247 | 96.89 | 104.52 |
| 2017 | 8,592,400 | 0.27 | 22,767 | 96.81 | 104.27 |
| 2016 | 8,569,633 | 0.29 | 25,047 | 96.69 | 103.99 |
| 2015 | 8,544,586 | 0.32 | 27,670 | 96.51 | 103.69 |
| 2014 | 8,516,916 | 0.35 | 29,954 | 96.25 | 103.35 |
| 2013 | 8,486,962 | 0.37 | 31,485 | 95.94 | 102.99 |
| 2012 | 8,455,477 | 0.38 | 31,918 | 95.60 | 102.60 |
| 2011 | 8,423,559 | 0.38 | 31,573 | 95.29 | 102.22 |
| 2010 | 8,391,986 | 0.37 | 30,624 | 95.04 | 101.83 |
| 2005 | 8,234,858 | 2.29 | 183,974 | 94.56 | 99.93 |
| 2000 | 8,050,884 | 0.98 | 78,051 | 94.29 | 97.69 |
| 1995 | 7,972,833 | 3.45 | 266,262 | 93.30 | 96.75 |
| 1990 | 7,706,571 | 1.40 | 106,057 | 91.70 | 93.52 |
| 1985 | 7,600,514 | 0.04 | 3,245 | 90.62 | 92.23 |
| 1980 | 7,597,269 | -0.40 | -30,869 | 89.82 | 92.19 |
| 1975 | 7,628,138 | 1.58 | 118,392 | 89.26 | 92.56 |
| 1970 | 7,509,746 | 2.89 | 210,952 | 88.60 | 91.13 |
| 1965 | 7,298,794 | 3.30 | 233,269 | 87.86 | 88.57 |
| 1960 | 7,065,525 | 1.67 | 116,043 | 87.23 | 85.74 |
| 1955 | 6,949,482 | 0.19 | 13,037 | 86.86 | 84.33 |
| 1950 | 6,936,445 | 86.64 | 84.17 |