Anguilla population
18,080
Births this year: 2,082
Births today 0
Deaths this year 754
Deaths today 0
18,080
| Region Name | Percents | Number |
|---|---|---|
| Protestant (Anglican, Methodist, other Protestant) | 83.1% | 13,921 people |
| Roman Catholic | 5.7% | 955 people |
| other Christian | 1.7% | 285 people |
| other | 5.2% | 871 people |
| none or unspecified | 4.3% | 720 people |
| Ethnic groups Name | Percents | Number |
|---|---|---|
| black (predominant) | 90.1% | 15,094 people |
| mixed, mulatto | 4.6% | 771 people |
| white | 3.7% | 620 people |
| other | 1.5% | 251 people |
| Year | Population | Yearly % Change |
Yearly Change |
Sex ratio | Density (P/Km²) |
|---|---|---|---|---|---|
| 2025 | 15,582 | 0.30 | 47 | 96.37 | 173.13 |
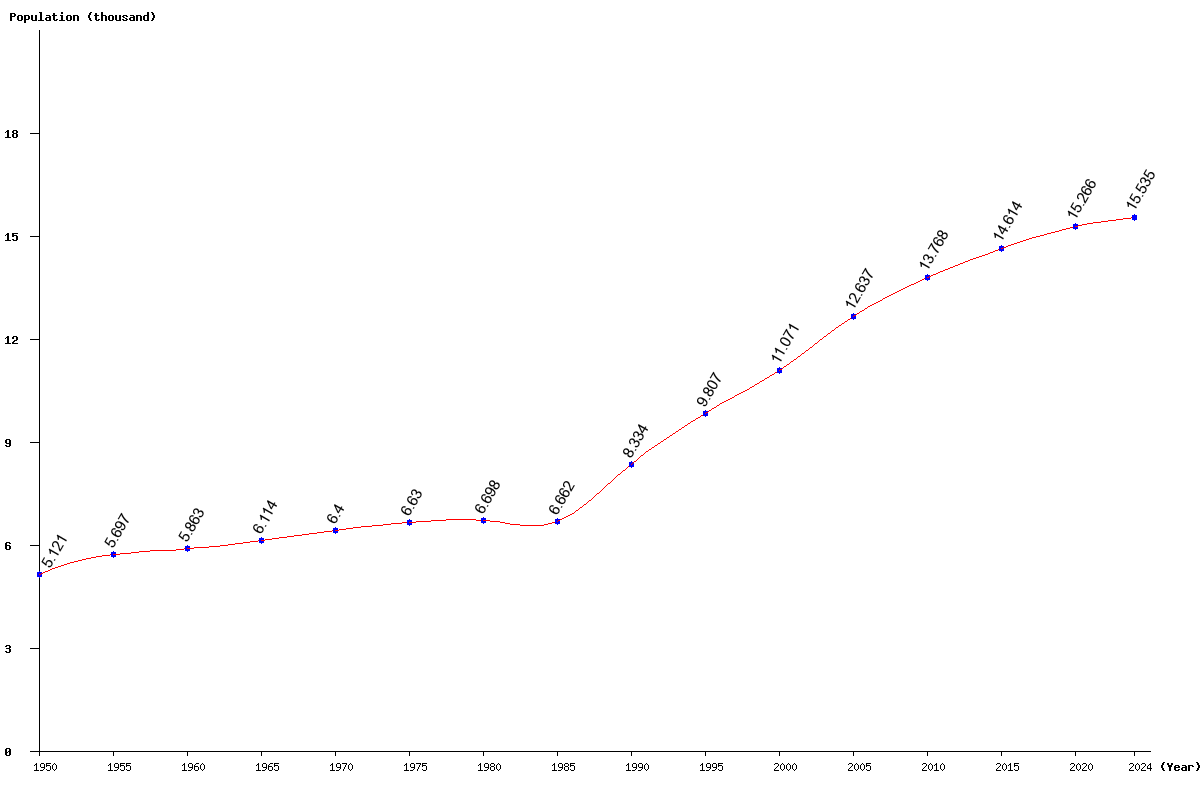
| 2024 | 15,535 | 0.33 | 51 | 96.45 | 172.61 |
| 2023 | 15,484 | 0.38 | 59 | 96.53 | 172.04 |
| 2022 | 15,425 | 0.47 | 72 | 96.61 | 171.39 |
| 2021 | 15,353 | 0.57 | 87 | 96.69 | 170.59 |
| 2020 | 15,266 | 0.69 | 105 | 96.78 | 169.62 |
| 2019 | 15,161 | 0.80 | 121 | 96.86 | 168.46 |
| 2018 | 15,040 | 0.90 | 134 | 96.94 | 167.11 |
| 2017 | 14,906 | 0.97 | 143 | 97.02 | 165.62 |
| 2016 | 14,763 | 1.02 | 149 | 97.10 | 164.03 |
| 2015 | 14,614 | 1.07 | 154 | 97.19 | 162.38 |
| 2014 | 14,460 | 1.12 | 160 | 97.27 | 160.67 |
| 2013 | 14,300 | 1.18 | 167 | 97.36 | 158.89 |
| 2012 | 14,133 | 1.27 | 177 | 97.45 | 157.03 |
| 2011 | 13,956 | 1.37 | 188 | 97.52 | 155.07 |
| 2010 | 13,768 | 1.45 | 197 | 97.58 | 152.98 |
| 2005 | 12,637 | 14.15 | 1,566 | 97.67 | 140.41 |
| 2000 | 11,071 | 12.89 | 1,264 | 97.84 | 123.01 |
| 1995 | 9,807 | 17.67 | 1,473 | 98.94 | 108.97 |
| 1990 | 8,334 | 25.10 | 1,672 | 98.15 | 92.60 |
| 1985 | 6,662 | -0.54 | -36 | 99.42 | 74.02 |
| 1980 | 6,698 | 1.03 | 68 | 100.31 | 74.42 |
| 1975 | 6,630 | 3.59 | 230 | 100.47 | 73.67 |
| 1970 | 6,400 | 4.68 | 286 | 100.47 | 71.11 |
| 1965 | 6,114 | 4.28 | 251 | 100.35 | 67.93 |
| 1960 | 5,863 | 2.91 | 166 | 100.30 | 65.14 |
| 1955 | 5,697 | 11.25 | 576 | 100.28 | 63.30 |
| 1950 | 5,121 | 100.65 | 56.90 |