Uganda population
3,831,924
Births this year: 0
Births today 0
Deaths this year 0
Deaths today 0
3,831,924
| Region Name | Percents | Number |
|---|---|---|
| Roman Catholic | 41.9% | 1,605,576 people |
| Protestant (Anglican, Pentecostal, Seventh-Day Adventist) | 42% | 1,609,408 people |
| Muslim | 12.1% | 463,663 people |
| other | 3.1% | 118,790 people |
| none | 0.9% | 34,487 people |
| Ethnic groups Name | Percents | Number |
|---|---|---|
| Baganda | 16.9% | 647,595 people |
| Banyankole | 9.5% | 364,033 people |
| Basoga | 8.4% | 321,882 people |
| Bakiga | 6.9% | 264,403 people |
| Iteso | 6.4% | 245,243 people |
| Langi | 6.1% | 233,747 people |
| Acholi | 4.7% | 180,100 people |
| Bagisu | 4.6% | 176,269 people |
| Lugbara | 4.2% | 160,941 people |
| Bunyoro | 2.7% | 103,462 people |
| other | 29.6% | 1,134,250 people |
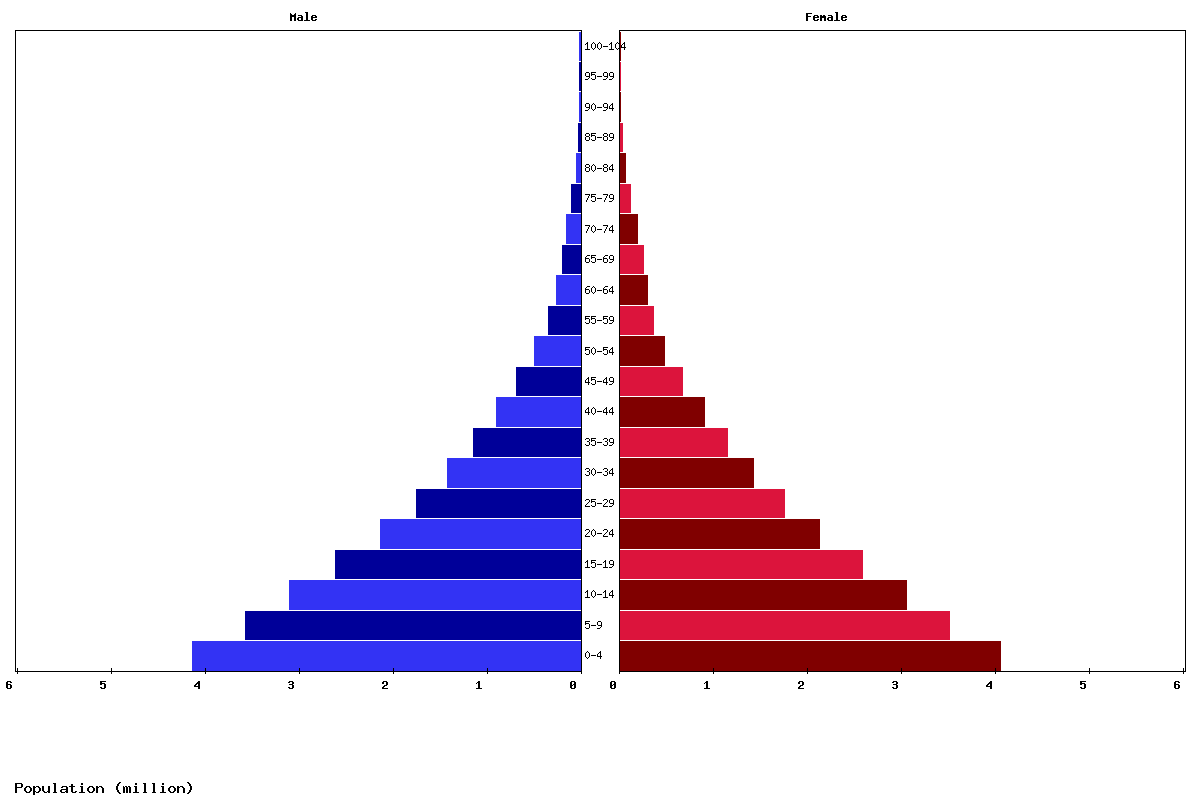
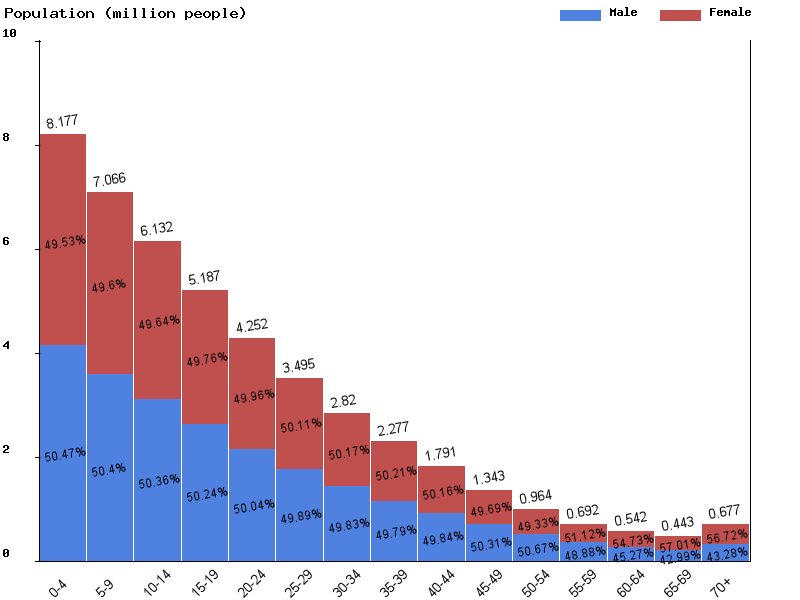
| Age | Both Sexes Population | Male Population | Female Population | Both Sexes (%) | Male (%) | Female (%) | Sex ratio (female/male) |
|---|---|---|---|---|---|---|---|
| Total | 53,496,737 | 26,728,796 | 26,767,941 | 100 | 100 | 100 | 99.9 |
| 00-04 | 9,077,637 | 4,580,260 | 4,497,377 | 17 | 17.1 | 16.8 | 101.8 |
| 05-09 | 7,964,798 | 4,012,406 | 3,952,392 | 14.9 | 15 | 14.8 | 101.5 |
| 10-14 | 6,975,047 | 3,512,532 | 3,462,515 | 13 | 13.1 | 12.9 | 101.4 |
| 15-19 | 6,051,307 | 3,044,273 | 3,007,034 | 11.3 | 11.4 | 11.2 | 101.2 |
| 20-24 | 5,093,693 | 2,552,477 | 2,541,216 | 9.5 | 9.5 | 9.5 | 100.4 |
| 25-29 | 4,158,500 | 2,074,548 | 2,083,952 | 7.8 | 7.8 | 7.8 | 99.5 |
| 30-34 | 3,407,766 | 1,694,491 | 1,713,275 | 6.4 | 6.3 | 6.4 | 98.9 |
| 35-39 | 2,740,525 | 1,358,793 | 1,381,732 | 5.1 | 5.1 | 5.2 | 98.3 |
| 40-44 | 2,203,981 | 1,091,211 | 1,112,770 | 4.1 | 4.1 | 4.2 | 98.1 |
| 45-49 | 1,727,885 | 856,303 | 871,582 | 3.2 | 3.2 | 3.3 | 98.2 |
| 50-54 | 1,284,958 | 642,001 | 642,957 | 2.4 | 2.4 | 2.4 | 99.9 |
| 55-59 | 909,121 | 456,717 | 452,404 | 1.7 | 1.7 | 1.7 | 101 |
| 60-64 | 638,196 | 308,469 | 329,727 | 1.2 | 1.2 | 1.2 | 93.6 |
| 65-69 | 479,216 | 213,593 | 265,623 | 0.9 | 0.8 | 1 | 80.4 |
| 70-74 | 365,776 | 154,321 | 211,455 | 0.7 | 0.6 | 0.8 | 73 |
| 75-79 | 235,154 | 99,790 | 135,364 | 0.4 | 0.4 | 0.5 | 73.7 |
| 80-84 | 124,645 | 53,167 | 71,478 | 0.2 | 0.2 | 0.3 | 74.4 |
| 85-89 | 43,679 | 17,972 | 25,707 | 0.1 | 0.1 | 0.1 | 69.9 |
| 90-94 | 12,865 | 4,836 | 8,029 | 0 | 0 | 0 | 60.2 |
| 95-99 | 1,843 | 598 | 1,245 | 0 | 0 | 0 | 48 |
| 100+ | 145 | 38 | 107 | 0 | 0 | 0 | 35.5 |
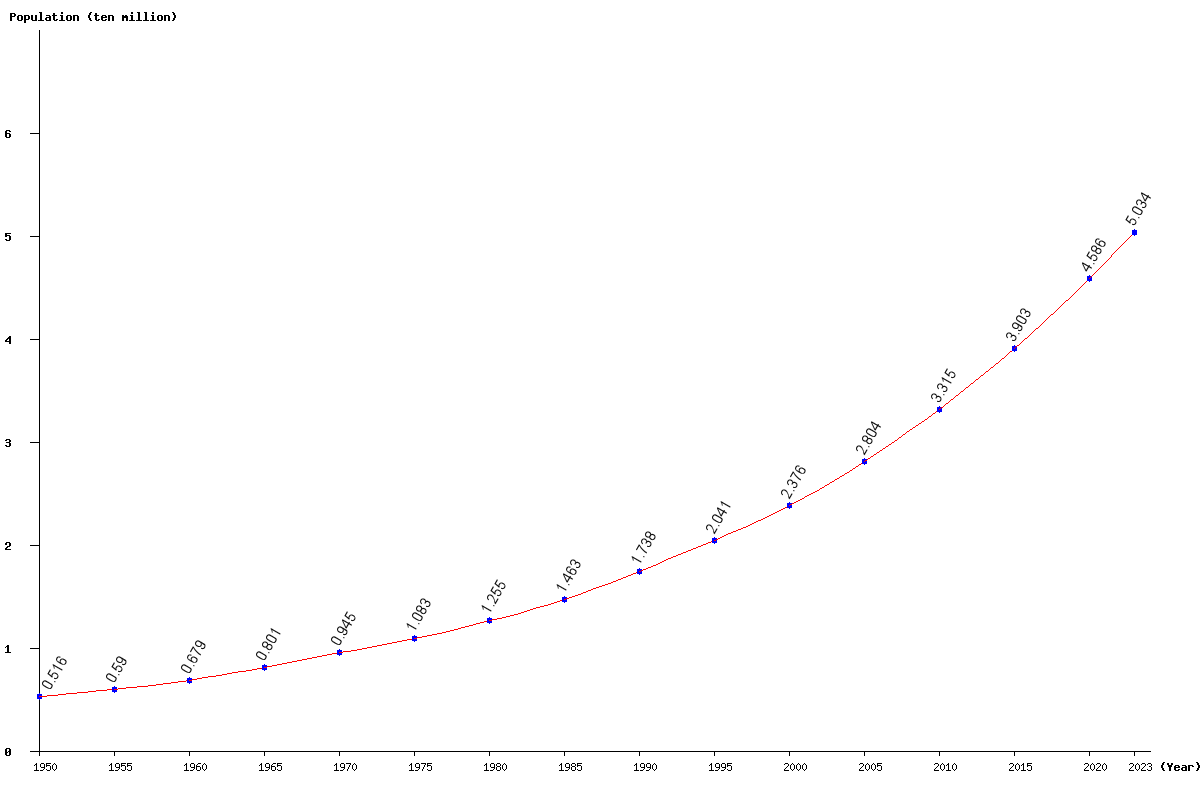
| Year | Population | Yearly % Change |
Yearly Change |
Sex ratio | Density (P/Km²) |
|---|---|---|---|---|---|
| 2025 | 53,496,737 | 3.07 | 1,592,269 | 99.85 | 267.74 |
| 2024 | 51,904,468 | 3.10 | 1,559,793 | 99.87 | 259.77 |
| 2023 | 50,344,675 | 3.13 | 1,527,630 | 99.88 | 251.96 |
| 2022 | 48,817,045 | 3.16 | 1,496,038 | 99.88 | 244.32 |
| 2021 | 47,321,007 | 3.19 | 1,464,640 | 99.89 | 236.83 |
| 2020 | 45,856,367 | 3.23 | 1,433,705 | 99.89 | 229.50 |
| 2019 | 44,422,662 | 3.26 | 1,401,981 | 99.90 | 222.32 |
| 2018 | 43,020,681 | 3.28 | 1,367,743 | 99.91 | 215.31 |
| 2017 | 41,652,938 | 3.30 | 1,330,170 | 99.91 | 208.46 |
| 2016 | 40,322,768 | 3.31 | 1,290,385 | 99.91 | 201.81 |
| 2015 | 39,032,383 | 3.31 | 1,249,412 | 99.91 | 195.35 |
| 2014 | 37,782,971 | 3.31 | 1,209,584 | 99.89 | 189.09 |
| 2013 | 36,573,387 | 3.31 | 1,172,767 | 99.87 | 183.04 |
| 2012 | 35,400,620 | 3.33 | 1,140,278 | 99.84 | 177.17 |
| 2011 | 34,260,342 | 3.35 | 1,110,925 | 99.80 | 171.46 |
| 2010 | 33,149,417 | 3.38 | 1,082,292 | 99.74 | 165.90 |
| 2005 | 28,042,413 | 18.04 | 4,284,777 | 99.28 | 140.35 |
| 2000 | 23,757,636 | 16.39 | 3,344,669 | 98.83 | 118.90 |
| 1995 | 20,412,967 | 17.42 | 3,028,598 | 98.57 | 102.16 |
| 1990 | 17,384,369 | 18.82 | 2,753,280 | 98.69 | 87.00 |
| 1985 | 14,631,089 | 16.60 | 2,083,335 | 98.93 | 73.23 |
| 1980 | 12,547,754 | 15.89 | 1,720,683 | 98.99 | 62.80 |
| 1975 | 10,827,071 | 14.62 | 1,381,047 | 98.92 | 54.19 |
| 1970 | 9,446,024 | 17.86 | 1,431,648 | 98.83 | 47.28 |
| 1965 | 8,014,376 | 18.06 | 1,226,165 | 98.77 | 40.11 |
| 1960 | 6,788,211 | 15.08 | 889,377 | 98.84 | 33.97 |
| 1955 | 5,898,834 | 14.36 | 740,641 | 99.05 | 29.52 |
| 1950 | 5,158,193 | 99.49 | 25.82 |