Australia population
23,871,780
Births this year: 2,170,902
Births today 93
Deaths this year 1,291,776
Deaths today 55
23,871,780
| Region Name | Percents | Number |
|---|---|---|
| Protestant (Anglican, Uniting Church, Presbyterian and Reformed, Baptist, Lutheran, Pentecostal) | 28.8% | 6,621,884 people |
| Catholic | 25.3% | 5,817,141 people |
| Eastern Orthodox | 2.6% | 597,809 people |
| other Christian | 4.5% | 1,034,669 people |
| Buddhist | 2.5% | 574,816 people |
| Muslim | 2.2% | 505,838 people |
| Hindu | 1.3% | 298,905 people |
| other | 8.4% | 1,931,383 people |
| unspecified | 2.2% | 505,838 people |
| none | 22.3% | 5,127,362 people |
| Ethnic groups Name | Percents | Number |
|---|---|---|
| white | 92% | 21,153,242 people |
| Asian | 7% | 1,609,486 people |
| aboriginal and other | 1% | 229,927 people |
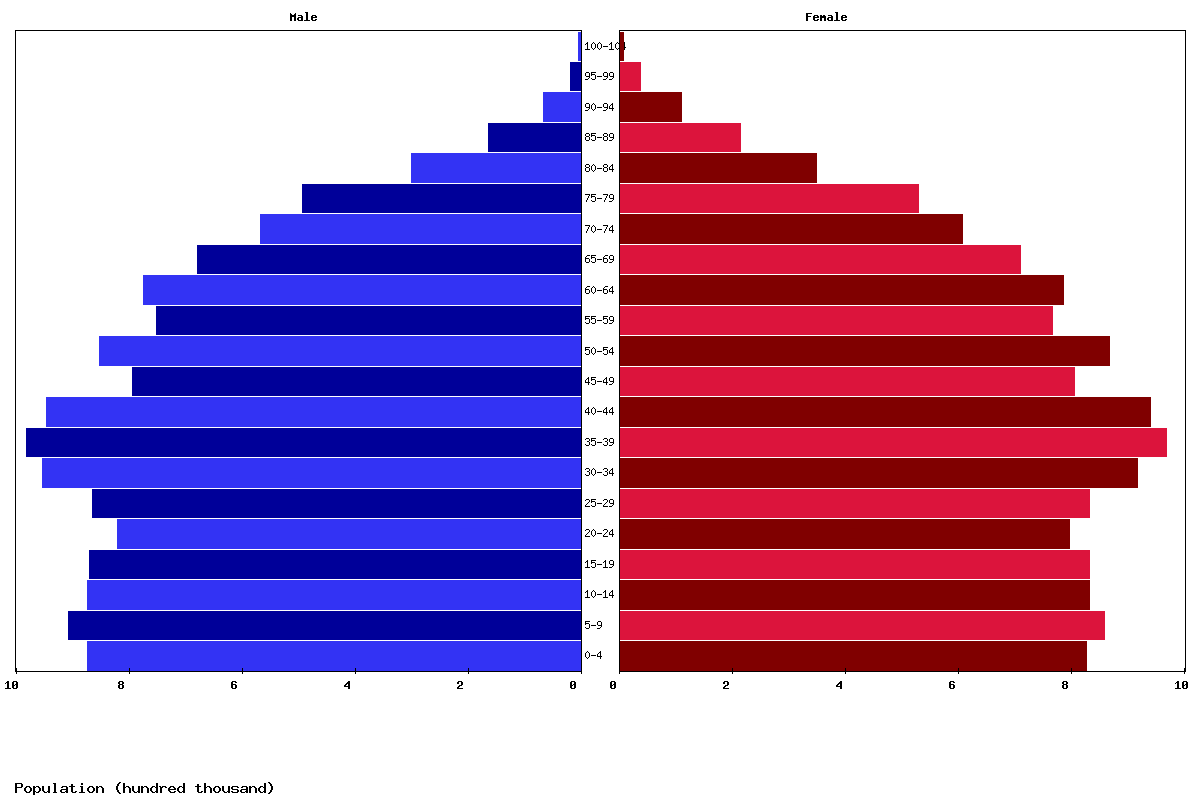
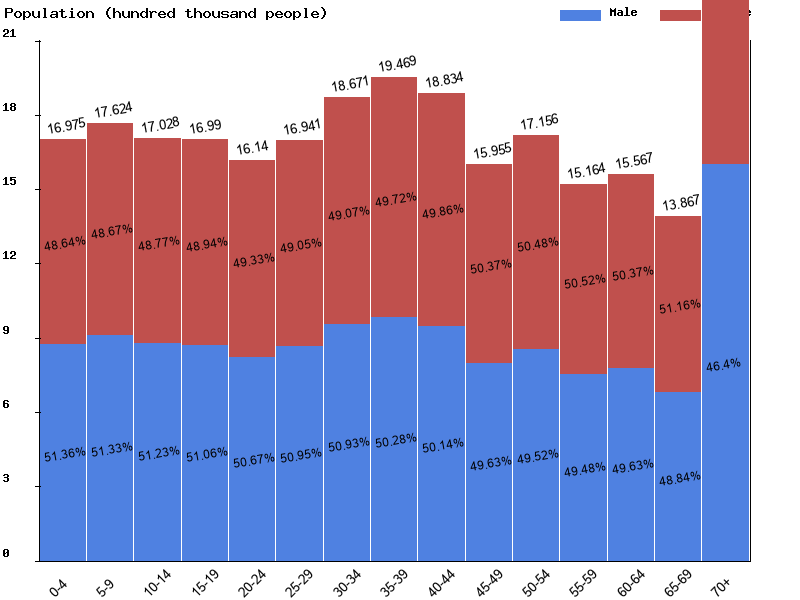
| Age | Both Sexes Population | Male Population | Female Population | Both Sexes (%) | Male (%) | Female (%) | Sex ratio (female/male) |
|---|---|---|---|---|---|---|---|
| Total | 25,597,574 | 12,779,790 | 12,817,784 | 100 | 100 | 100 | 99.7 |
| 00-04 | 1,691,301 | 868,592 | 822,709 | 6.6 | 6.8 | 6.4 | 105.6 |
| 05-09 | 1,626,659 | 834,917 | 791,742 | 6.4 | 6.5 | 6.2 | 105.5 |
| 10-14 | 1,609,226 | 824,969 | 784,257 | 6.3 | 6.5 | 6.1 | 105.2 |
| 15-19 | 1,514,670 | 772,476 | 742,194 | 5.9 | 6 | 5.8 | 104.1 |
| 20-24 | 1,599,898 | 821,216 | 778,682 | 6.3 | 6.4 | 6.1 | 105.5 |
| 25-29 | 1,786,086 | 914,375 | 871,711 | 7 | 7.2 | 6.8 | 104.9 |
| 30-34 | 1,885,386 | 950,211 | 935,175 | 7.4 | 7.4 | 7.3 | 101.6 |
| 35-39 | 1,847,595 | 927,575 | 920,020 | 7.2 | 7.3 | 7.2 | 100.8 |
| 40-44 | 1,582,082 | 786,100 | 795,982 | 6.2 | 6.2 | 6.2 | 98.8 |
| 45-49 | 1,724,154 | 855,287 | 868,867 | 6.7 | 6.7 | 6.8 | 98.4 |
| 50-54 | 1,533,874 | 761,149 | 772,725 | 6 | 6 | 6 | 98.5 |
| 55-59 | 1,587,811 | 791,638 | 796,173 | 6.2 | 6.2 | 6.2 | 99.4 |
| 60-64 | 1,431,790 | 704,543 | 727,247 | 5.6 | 5.5 | 5.7 | 96.9 |
| 65-69 | 1,236,358 | 603,637 | 632,721 | 4.8 | 4.7 | 4.9 | 95.4 |
| 70-74 | 1,120,521 | 551,352 | 569,169 | 4.4 | 4.3 | 4.4 | 96.9 |
| 75-79 | 768,904 | 368,723 | 400,181 | 3 | 2.9 | 3.1 | 92.1 |
| 80-84 | 524,012 | 240,434 | 283,578 | 2 | 1.9 | 2.2 | 84.8 |
| 85-89 | 325,223 | 134,166 | 191,057 | 1.3 | 1 | 1.5 | 70.2 |
| 90-94 | 155,069 | 55,199 | 99,870 | 0.6 | 0.4 | 0.8 | 55.3 |
| 95-99 | 42,247 | 12,258 | 29,989 | 0.2 | 0.1 | 0.2 | 40.9 |
| 100+ | 4,708 | 973 | 3,735 | 0 | 0 | 0 | 26.1 |
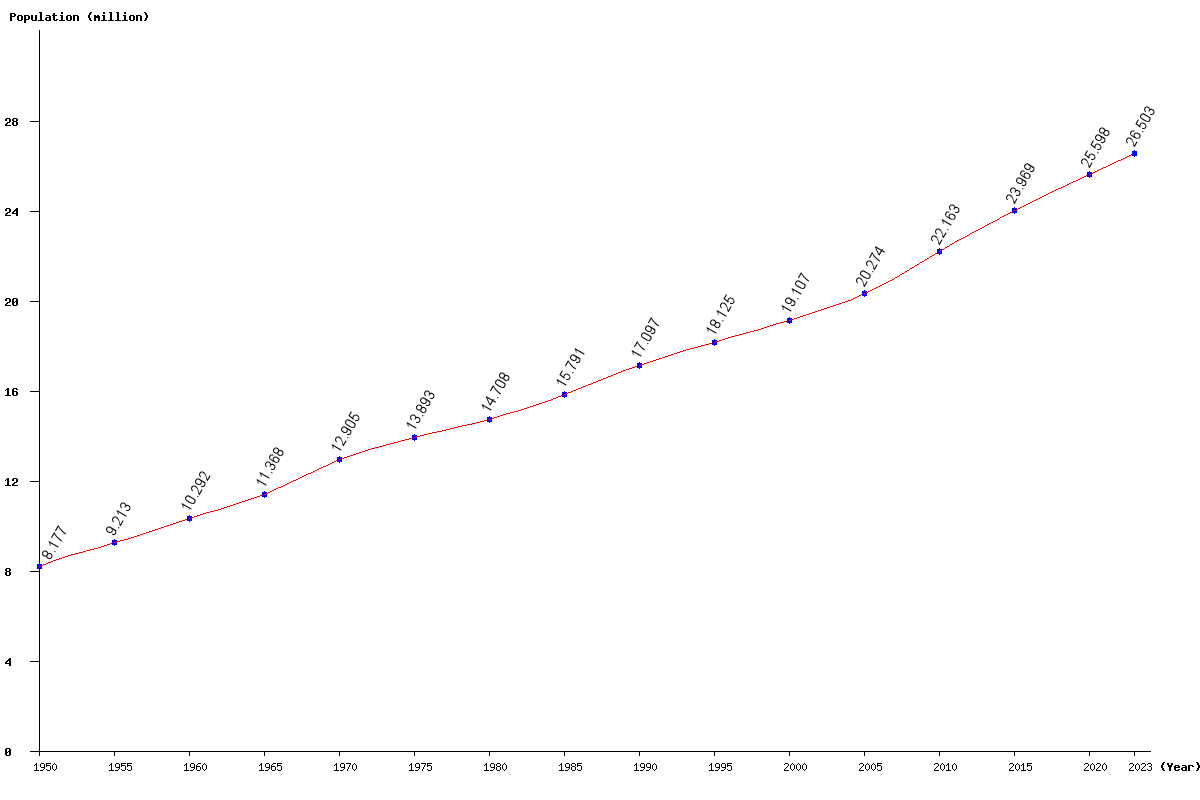
| Year | Population | Yearly % Change |
Yearly Change |
Sex ratio | Density (P/Km²) |
|---|---|---|---|---|---|
| 2023 | 26,502,580 | 1.13 | 296,533 | 99.62 | 3.45 |
| 2022 | 26,206,047 | 1.16 | 301,429 | 99.65 | 3.41 |
| 2021 | 25,904,618 | 1.20 | 307,044 | 99.68 | 3.37 |
| 2020 | 25,597,574 | 1.24 | 312,672 | 99.70 | 3.33 |
| 2019 | 25,284,902 | 1.28 | 318,371 | 99.73 | 3.29 |
| 2018 | 24,966,531 | 1.32 | 324,869 | 99.76 | 3.25 |
| 2017 | 24,641,662 | 1.37 | 332,332 | 99.78 | 3.21 |
| 2016 | 24,309,330 | 1.42 | 340,357 | 99.82 | 3.16 |
| 2015 | 23,968,973 | 1.47 | 346,620 | 99.86 | 3.12 |
| 2014 | 23,622,353 | 1.51 | 351,888 | 99.91 | 3.07 |
| 2013 | 23,270,465 | 1.57 | 359,090 | 99.98 | 3.03 |
| 2012 | 22,911,375 | 1.64 | 369,004 | 100.04 | 2.98 |
| 2011 | 22,542,371 | 1.71 | 379,508 | 100.08 | 2.93 |
| 2010 | 22,162,863 | 1.80 | 392,173 | 100.08 | 2.88 |
| 2005 | 20,274,282 | 6.11 | 1,167,031 | 99.60 | 2.64 |
| 2000 | 19,107,251 | 5.42 | 982,481 | 99.53 | 2.49 |
| 1995 | 18,124,770 | 6.01 | 1,027,901 | 99.03 | 2.36 |
| 1990 | 17,096,869 | 8.27 | 1,305,826 | 99.47 | 2.23 |
| 1985 | 15,791,043 | 7.36 | 1,082,720 | 99.73 | 2.06 |
| 1980 | 14,708,323 | 5.87 | 815,649 | 99.72 | 1.91 |
| 1975 | 13,892,674 | 7.66 | 987,914 | 100.60 | 1.81 |
| 1970 | 12,904,760 | 13.52 | 1,536,749 | 101.16 | 1.68 |
| 1965 | 11,368,011 | 10.45 | 1,075,683 | 101.49 | 1.48 |
| 1960 | 10,292,328 | 11.72 | 1,079,504 | 102.11 | 1.34 |
| 1955 | 9,212,824 | 12.66 | 1,035,480 | 102.47 | 1.20 |
| 1950 | 8,177,344 | 101.57 | 1.06 |