Germany population
78,769,287
Births this year: 5,356,385
Births today 705
Deaths this year 7,309,891
Deaths today 962
78,769,287
| Region Name | Percents | Number |
|---|---|---|
| Protestant | 34% | 27,445,749 people |
| Roman Catholic | 34% | 27,445,749 people |
| Muslim | 3.7% | 2,986,743 people |
| unaffiliated or other | 28.3% | 22,844,550 people |
| Ethnic groups Name | Percents | Number |
|---|---|---|
| German | 91.5% | 73,861,355 people |
| Turkish | 2.4% | 1,937,347 people |
| other (made up largely of Greek, Italian, Polish, Russian, Serbo-Croatian, Spanish) | 6.1% | 4,924,090 people |
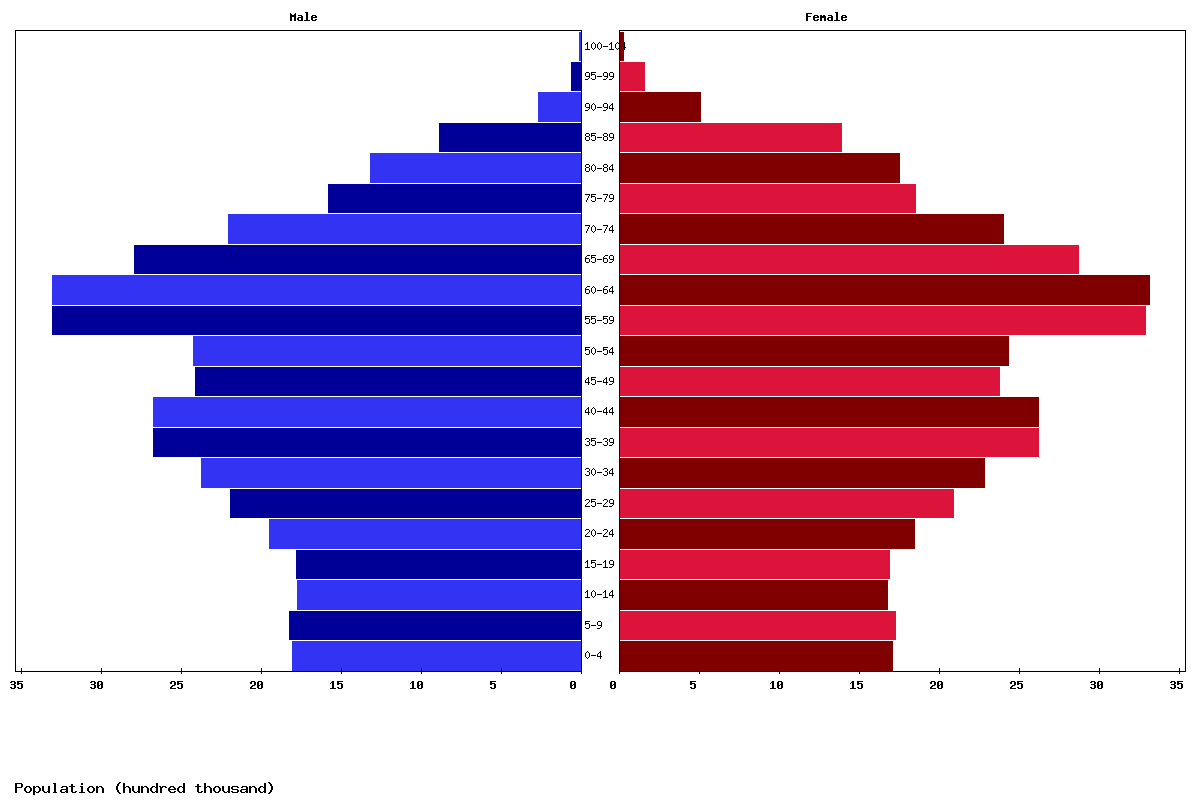
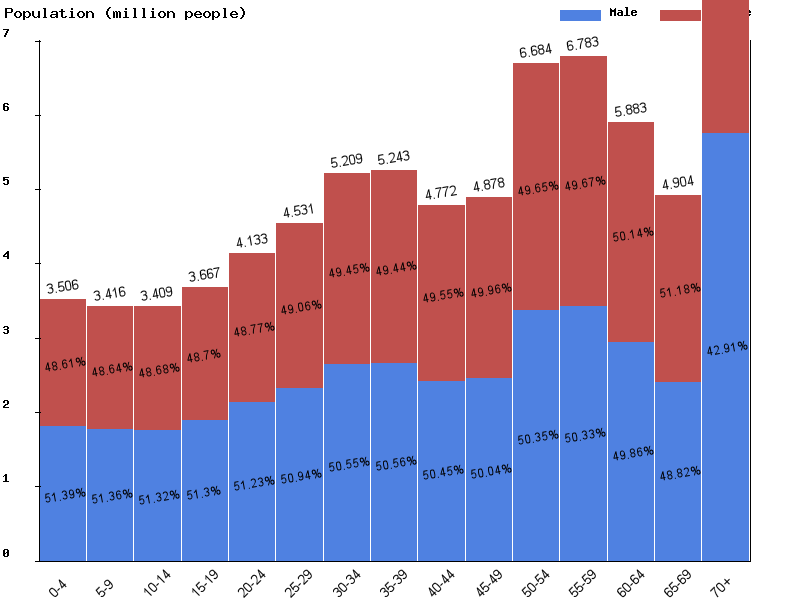
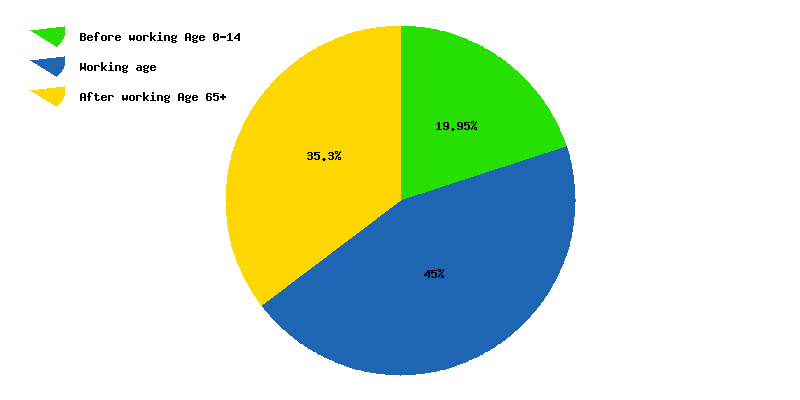
| Age | Both Sexes Population | Male Population | Female Population | Both Sexes (%) | Male (%) | Female (%) | Sex ratio (female/male) |
|---|---|---|---|---|---|---|---|
| Total | 80,392,216 | 39,590,388 | 40,801,828 | 100 | 100 | 100 | 97 |
| 00-04 | 3,505,710 | 1,801,680 | 1,704,030 | 4.4 | 4.6 | 4.2 | 105.7 |
| 05-09 | 3,415,956 | 1,754,593 | 1,661,363 | 4.2 | 4.4 | 4.1 | 105.6 |
| 10-14 | 3,409,305 | 1,749,683 | 1,659,622 | 4.2 | 4.4 | 4.1 | 105.4 |
| 15-19 | 3,667,169 | 1,881,382 | 1,785,787 | 4.6 | 4.8 | 4.4 | 105.4 |
| 20-24 | 4,132,612 | 2,117,084 | 2,015,528 | 5.1 | 5.3 | 4.9 | 105 |
| 25-29 | 4,531,212 | 2,308,178 | 2,223,034 | 5.6 | 5.8 | 5.4 | 103.8 |
| 30-34 | 5,208,525 | 2,632,924 | 2,575,601 | 6.5 | 6.7 | 6.3 | 102.2 |
| 35-39 | 5,243,457 | 2,651,067 | 2,592,390 | 6.5 | 6.7 | 6.4 | 102.3 |
| 40-44 | 4,772,032 | 2,407,267 | 2,364,765 | 5.9 | 6.1 | 5.8 | 101.8 |
| 45-49 | 4,878,324 | 2,440,976 | 2,437,348 | 6.1 | 6.2 | 6 | 100.1 |
| 50-54 | 6,683,579 | 3,364,954 | 3,318,625 | 8.3 | 8.5 | 8.1 | 101.4 |
| 55-59 | 6,783,020 | 3,414,012 | 3,369,008 | 8.4 | 8.6 | 8.3 | 101.3 |
| 60-64 | 5,883,459 | 2,933,668 | 2,949,791 | 7.3 | 7.4 | 7.2 | 99.5 |
| 65-69 | 4,903,811 | 2,394,086 | 2,509,725 | 6.1 | 6 | 6.2 | 95.4 |
| 70-74 | 3,832,182 | 1,820,277 | 2,011,905 | 4.8 | 4.6 | 4.9 | 90.5 |
| 75-79 | 3,765,514 | 1,696,234 | 2,069,280 | 4.7 | 4.3 | 5.1 | 82 |
| 80-84 | 3,337,847 | 1,391,285 | 1,946,562 | 4.2 | 3.5 | 4.8 | 71.5 |
| 85-89 | 1,558,720 | 583,512 | 975,208 | 1.9 | 1.5 | 2.4 | 59.8 |
| 90-94 | 696,201 | 210,293 | 485,908 | 0.9 | 0.5 | 1.2 | 43.3 |
| 95-99 | 169,366 | 34,914 | 134,452 | 0.2 | 0.1 | 0.3 | 26 |
| 100+ | 14,215 | 2,319 | 11,896 | 0 | 0 | 0 | 19.5 |
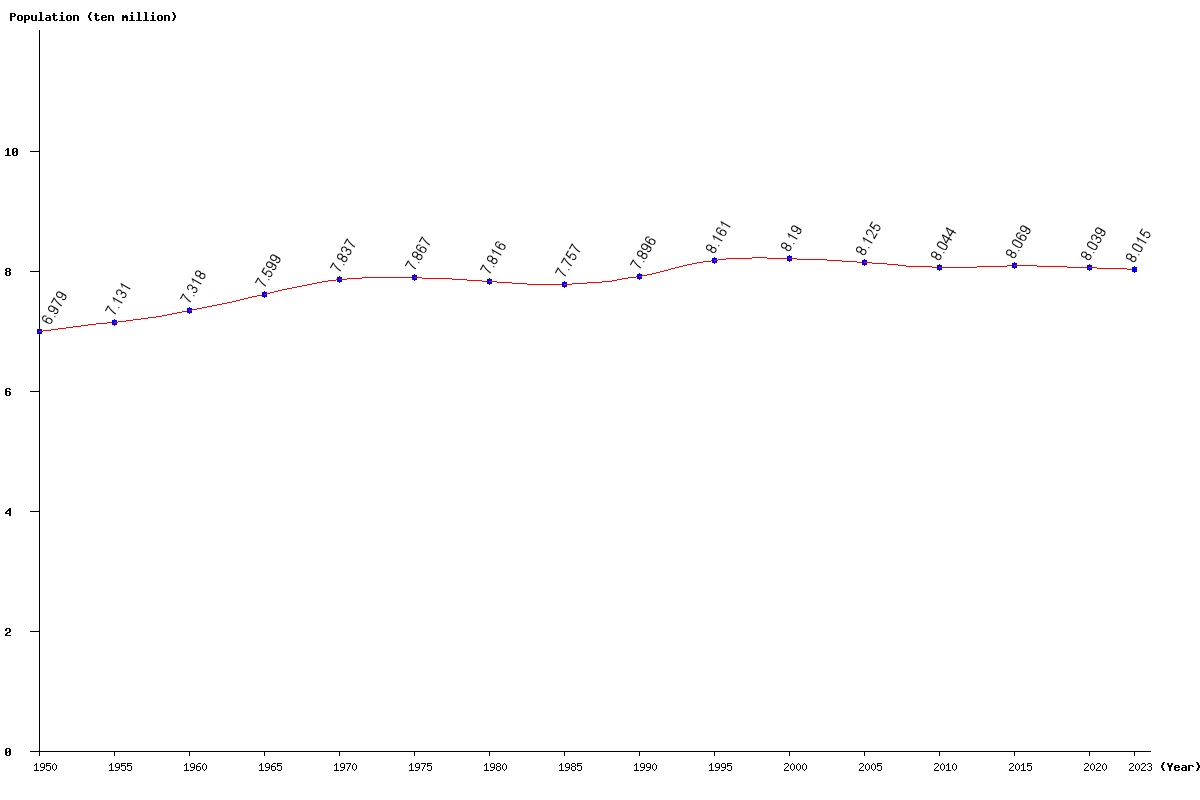
| Year | Population | Yearly % Change |
Yearly Change |
Sex ratio | Density (P/Km²) |
|---|---|---|---|---|---|
| 2023 | 80,152,495 | -0.10 | -82,557 | 97.25 | 229.95 |
| 2022 | 80,235,052 | -0.10 | -79,034 | 97.18 | 230.19 |
| 2021 | 80,314,086 | -0.10 | -78,130 | 97.10 | 230.42 |
| 2020 | 80,392,216 | -0.10 | -82,860 | 97.03 | 230.64 |
| 2019 | 80,475,076 | -0.11 | -85,774 | 96.96 | 230.88 |
| 2018 | 80,560,850 | -0.09 | -75,274 | 96.89 | 231.12 |
| 2017 | 80,636,124 | -0.06 | -46,227 | 96.81 | 231.34 |
| 2016 | 80,682,351 | -0.01 | -6,194 | 96.73 | 231.47 |
| 2015 | 80,688,545 | 0.05 | 42,283 | 96.63 | 231.49 |
| 2014 | 80,646,262 | 0.10 | 80,401 | 96.52 | 231.37 |
| 2013 | 80,565,861 | 0.11 | 87,909 | 96.39 | 231.14 |
| 2012 | 80,477,952 | 0.07 | 53,287 | 96.27 | 230.89 |
| 2011 | 80,424,665 | -0.01 | -10,642 | 96.16 | 230.73 |
| 2010 | 80,435,307 | -0.10 | -84,378 | 96.07 | 230.76 |
| 2005 | 81,246,801 | -0.79 | -649,124 | 95.95 | 233.09 |
| 2000 | 81,895,925 | 0.35 | 283,025 | 95.66 | 234.96 |
| 1995 | 81,612,900 | 3.36 | 2,654,663 | 95.06 | 234.14 |
| 1990 | 78,958,237 | 1.79 | 1,388,228 | 93.37 | 226.53 |
| 1985 | 77,570,009 | -0.75 | -589,518 | 91.56 | 222.54 |
| 1980 | 78,159,527 | -0.65 | -507,800 | 91.03 | 224.24 |
| 1975 | 78,667,327 | 0.38 | 300,722 | 90.33 | 225.69 |
| 1970 | 78,366,605 | 3.13 | 2,375,868 | 89.78 | 224.83 |
| 1965 | 75,990,737 | 3.84 | 2,811,072 | 88.81 | 218.01 |
| 1960 | 73,179,665 | 2.62 | 1,865,925 | 86.90 | 209.95 |
| 1955 | 71,313,740 | 2.19 | 1,527,494 | 86.36 | 204.60 |
| 1950 | 69,786,246 | 85.64 | 200.21 |