India population
1,404,336,523
Births this year: 198,770,224
Births today 45,573
Deaths this year 76,369,613
Deaths today 17,510
1,404,336,523
| Region Name | Percents | Number |
|---|---|---|
| Hindu | 80.5% | 1,031,958,408 people |
| Muslim | 13.4% | 171,779,412 people |
| Christian | 2.3% | 29,484,526 people |
| Sikh | 1.9% | 24,356,782 people |
| other | 1.8% | 23,074,846 people |
| unspecified | 0.1% | 1,281,936 people |
| Ethnic groups Name | Percents | Number |
|---|---|---|
| Indo-Aryan | 72% | 922,993,856 people |
| Dravidian | 25% | 320,483,978 people |
| Mongoloid and other | 3% | 38,458,077 people |
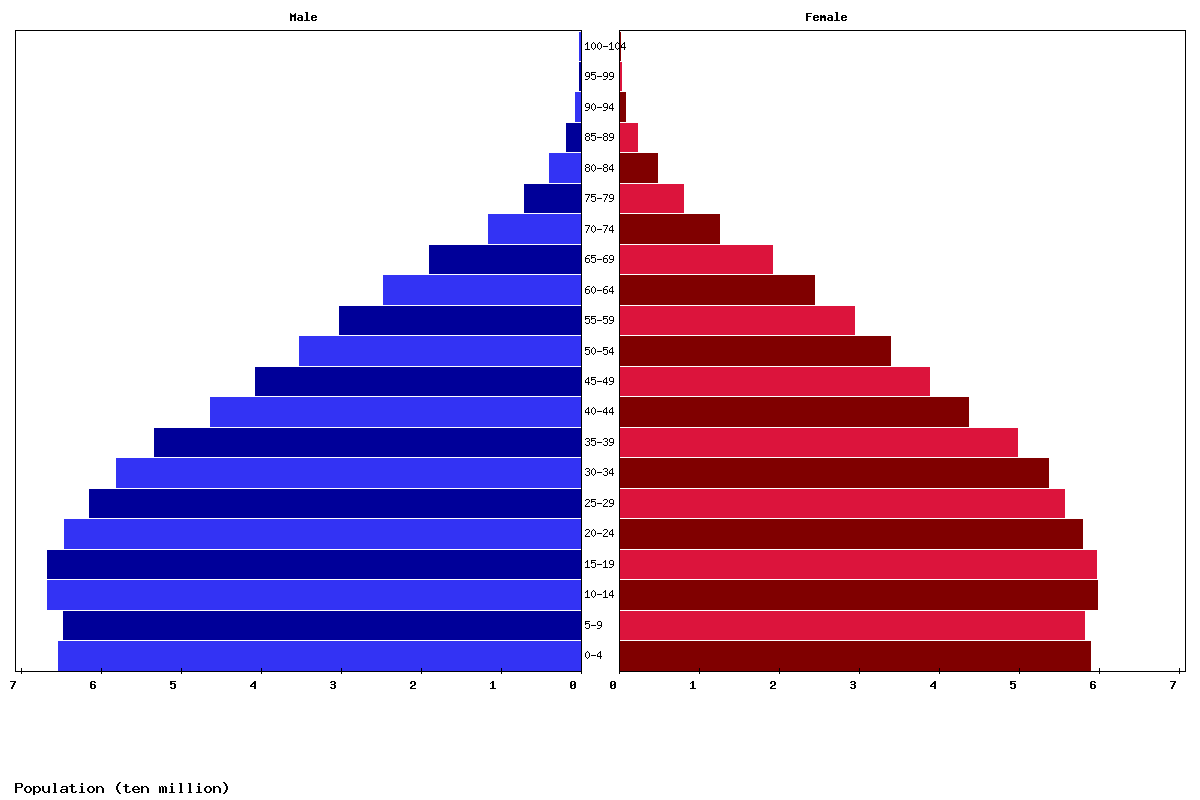
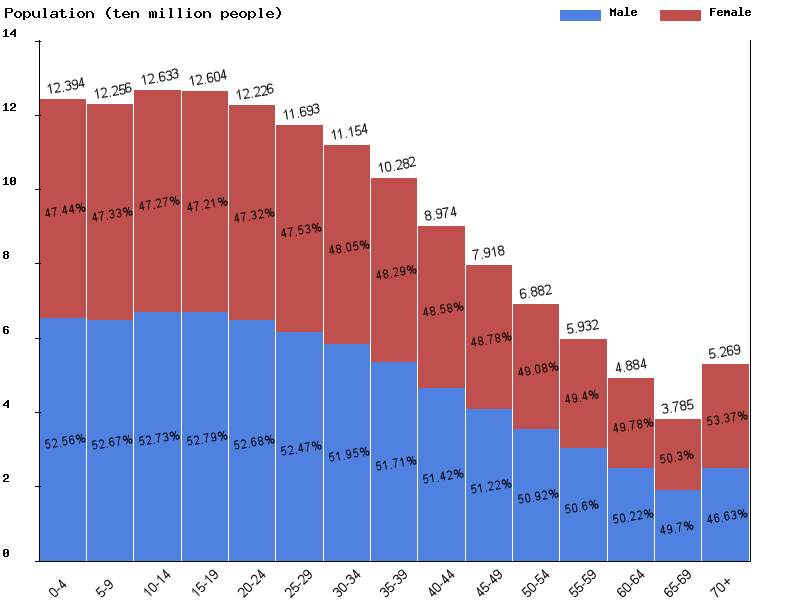
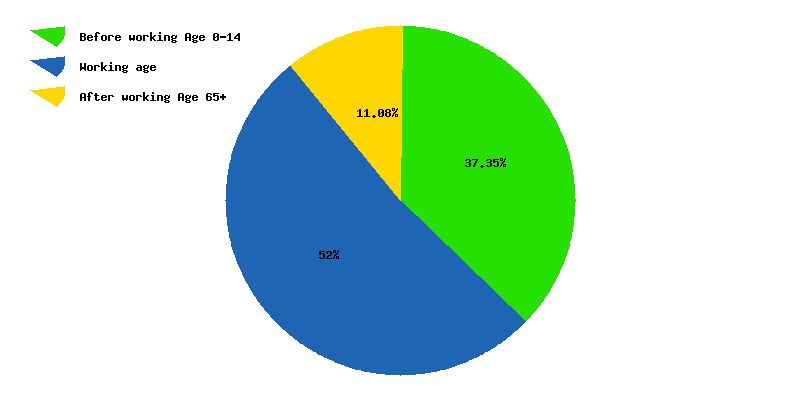
| Age | Both Sexes Population | Male Population | Female Population | Both Sexes (%) | Male (%) | Female (%) | Sex ratio (female/male) |
|---|---|---|---|---|---|---|---|
| Total | 1,461,625,234 | 756,312,822 | 705,312,412 | 100 | 100 | 100 | 107.2 |
| 00-04 | 122,777,175 | 64,412,482 | 58,364,693 | 8.4 | 8.5 | 8.3 | 110.4 |
| 05-09 | 122,989,247 | 64,683,381 | 58,305,866 | 8.4 | 8.6 | 8.3 | 110.9 |
| 10-14 | 122,027,195 | 64,276,288 | 57,750,907 | 8.3 | 8.5 | 8.2 | 111.3 |
| 15-19 | 125,709,505 | 66,304,116 | 59,405,389 | 8.6 | 8.8 | 8.4 | 111.6 |
| 20-24 | 125,067,429 | 66,036,156 | 59,031,273 | 8.6 | 8.7 | 8.4 | 111.9 |
| 25-29 | 121,109,398 | 63,756,777 | 57,352,621 | 8.3 | 8.4 | 8.1 | 111.2 |
| 30-34 | 115,764,278 | 60,635,150 | 55,129,128 | 7.9 | 8 | 7.8 | 110 |
| 35-39 | 110,228,677 | 57,091,169 | 53,137,508 | 7.5 | 7.5 | 7.5 | 107.4 |
| 40-44 | 101,272,276 | 52,131,648 | 49,140,628 | 6.9 | 6.9 | 7 | 106.1 |
| 45-49 | 87,895,625 | 44,929,758 | 42,965,867 | 6 | 5.9 | 6.1 | 104.6 |
| 50-54 | 76,819,826 | 39,029,479 | 37,790,347 | 5.3 | 5.2 | 5.4 | 103.3 |
| 55-59 | 65,742,401 | 33,114,271 | 32,628,130 | 4.5 | 4.4 | 4.6 | 101.5 |
| 60-64 | 55,132,263 | 27,531,036 | 27,601,227 | 3.8 | 3.6 | 3.9 | 99.7 |
| 65-69 | 43,342,737 | 21,421,889 | 21,920,848 | 3 | 2.8 | 3.1 | 97.7 |
| 70-74 | 31,308,949 | 15,241,372 | 16,067,577 | 2.1 | 2 | 2.3 | 94.9 |
| 75-79 | 17,879,804 | 8,349,653 | 9,530,151 | 1.2 | 1.1 | 1.4 | 87.6 |
| 80-84 | 9,836,051 | 4,448,749 | 5,387,302 | 0.7 | 0.6 | 0.8 | 82.6 |
| 85-89 | 4,692,148 | 2,041,777 | 2,650,371 | 0.3 | 0.3 | 0.4 | 77 |
| 90-94 | 1,605,084 | 692,009 | 913,075 | 0.1 | 0.1 | 0.1 | 75.8 |
| 95-99 | 368,067 | 161,001 | 207,066 | 0 | 0 | 0 | 77.8 |
| 100+ | 57,099 | 24,661 | 32,438 | 0 | 0 | 0 | 76 |
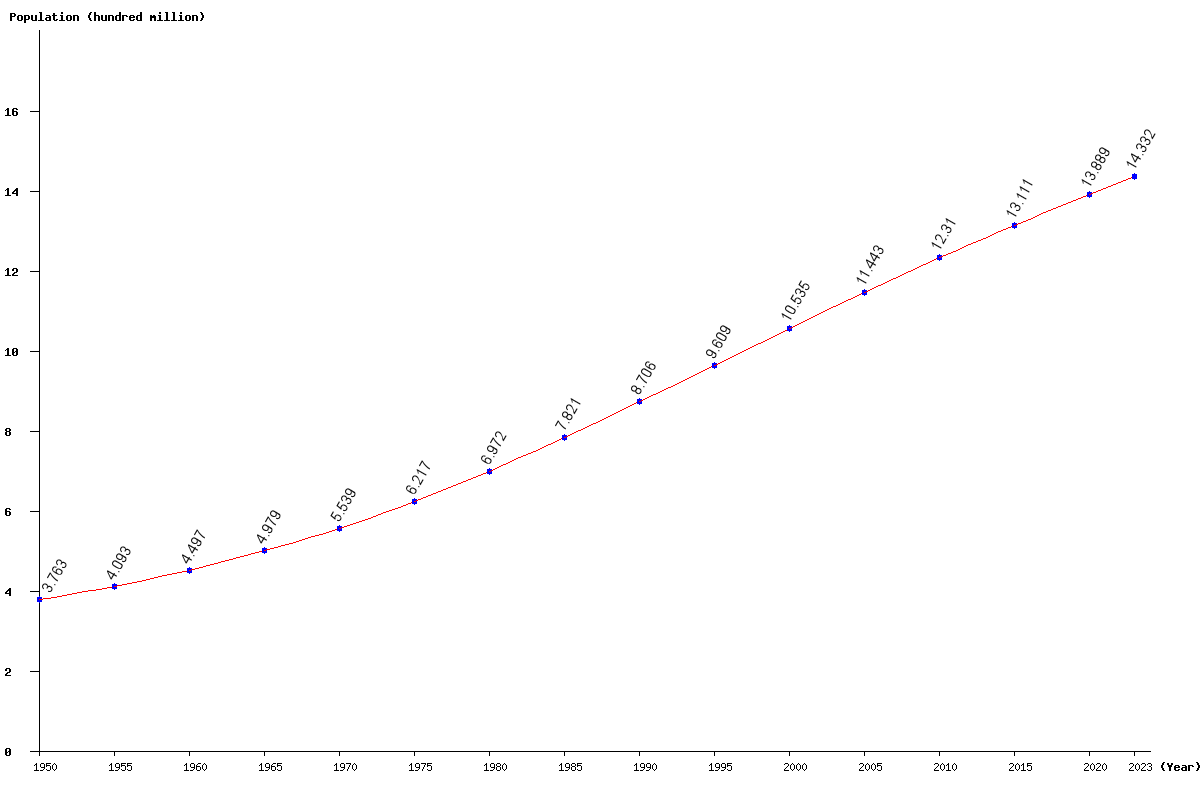
| Year | Population | Yearly % Change |
Yearly Change |
Sex ratio | Density (P/Km²) |
|---|---|---|---|---|---|
| 2024 | 1,447,560,464 | 1.00 | 14,317,791 | 107.28 | 486.87 |
| 2023 | 1,433,242,673 | 1.03 | 14,561,752 | 107.33 | 482.06 |
| 2022 | 1,418,680,921 | 1.05 | 14,798,232 | 107.38 | 477.16 |
| 2021 | 1,403,882,689 | 1.08 | 15,023,772 | 107.42 | 472.18 |
| 2020 | 1,388,858,917 | 1.11 | 15,253,848 | 107.46 | 467.13 |
| 2019 | 1,373,605,069 | 1.14 | 15,467,350 | 107.49 | 462.00 |
| 2018 | 1,358,137,719 | 1.16 | 15,625,013 | 107.52 | 456.79 |
| 2017 | 1,342,512,706 | 1.18 | 15,711,130 | 107.55 | 451.54 |
| 2016 | 1,326,801,576 | 1.20 | 15,751,049 | 107.58 | 446.26 |
| 2015 | 1,311,050,527 | 1.22 | 15,758,984 | 107.61 | 440.96 |
| 2014 | 1,295,291,543 | 1.23 | 15,792,669 | 107.64 | 435.66 |
| 2013 | 1,279,498,874 | 1.26 | 15,909,235 | 107.67 | 430.35 |
| 2012 | 1,263,589,639 | 1.29 | 16,143,628 | 107.69 | 424.99 |
| 2011 | 1,247,446,011 | 1.34 | 16,461,507 | 107.71 | 419.56 |
| 2010 | 1,230,984,504 | 1.38 | 16,802,322 | 107.72 | 414.03 |
| 2005 | 1,144,326,293 | 8.62 | 90,845,221 | 107.60 | 384.88 |
| 2000 | 1,053,481,072 | 9.64 | 92,606,090 | 107.46 | 354.33 |
| 1995 | 960,874,982 | 10.37 | 90,273,206 | 107.36 | 323.18 |
| 1990 | 870,601,776 | 11.32 | 88,516,649 | 107.27 | 292.82 |
| 1985 | 782,085,127 | 12.17 | 84,855,382 | 107.30 | 263.05 |
| 1980 | 697,229,745 | 12.15 | 75,526,104 | 107.42 | 234.51 |
| 1975 | 621,703,641 | 12.23 | 67,760,415 | 107.54 | 209.10 |
| 1970 | 553,943,226 | 11.25 | 56,022,956 | 107.37 | 186.31 |
| 1965 | 497,920,270 | 10.73 | 48,258,396 | 107.08 | 167.47 |
| 1960 | 449,661,874 | 9.87 | 40,381,678 | 106.61 | 151.24 |
| 1955 | 409,280,196 | 8.76 | 32,954,991 | 106.01 | 137.66 |
| 1950 | 376,325,205 | 105.40 | 126.57 |