Tunisia population
11,134,588
Births this year: 0
Births today 0
Deaths this year 0
Deaths today 0
11,134,588
| Region Name | Percents | Number |
|---|---|---|
| Muslim (official, Sunni) | 99.1% | 11,034,377 people |
| other | 0.9% | 100,211 people |
| Ethnic groups Name | Percents | Number |
|---|---|---|
| Arab | 98% | 10,911,896 people |
| European | 1% | 111,346 people |
| Jewish and other | 1% | 111,346 people |
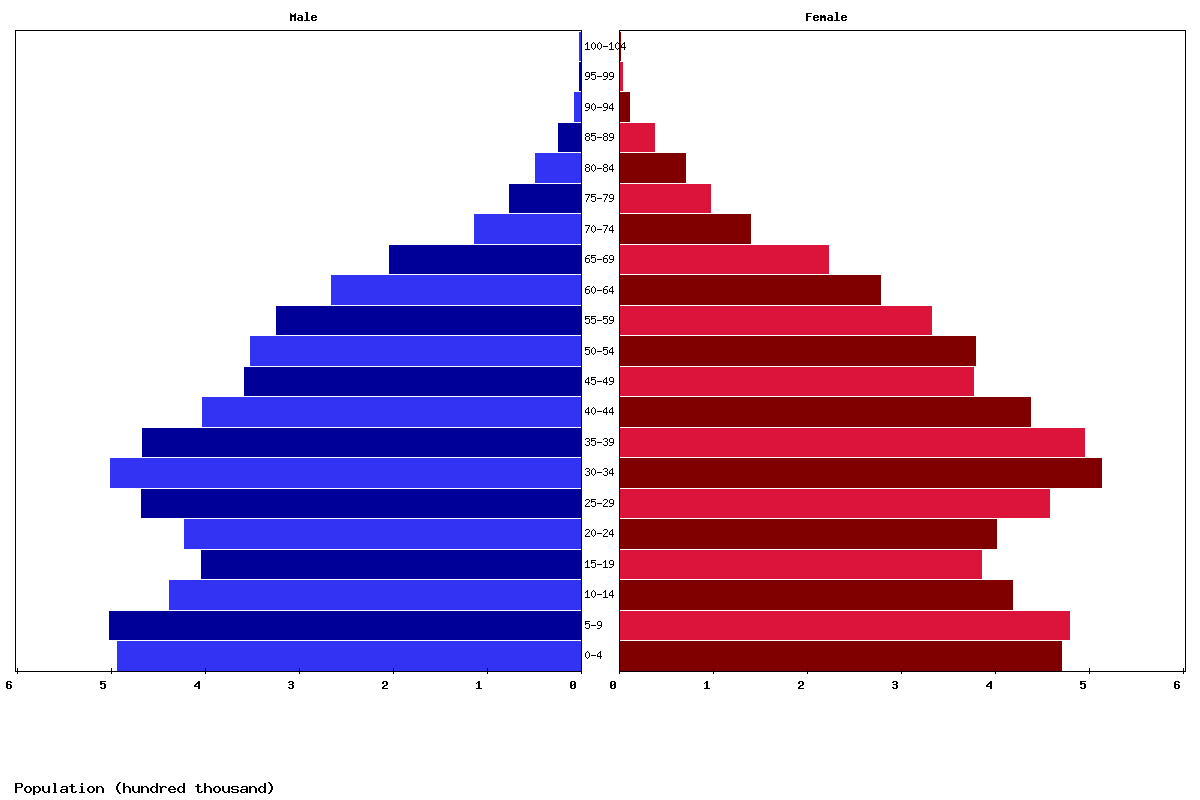
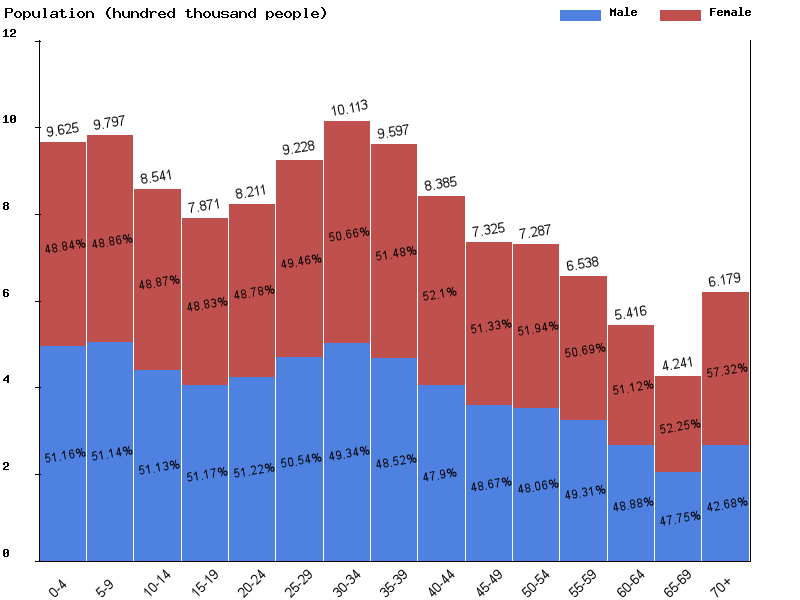
| Age | Both Sexes Population | Male Population | Female Population | Both Sexes (%) | Male (%) | Female (%) | Sex ratio (female/male) |
|---|---|---|---|---|---|---|---|
| Total | 12,320,107 | 6,084,035 | 6,236,072 | 100 | 100 | 100 | 97.6 |
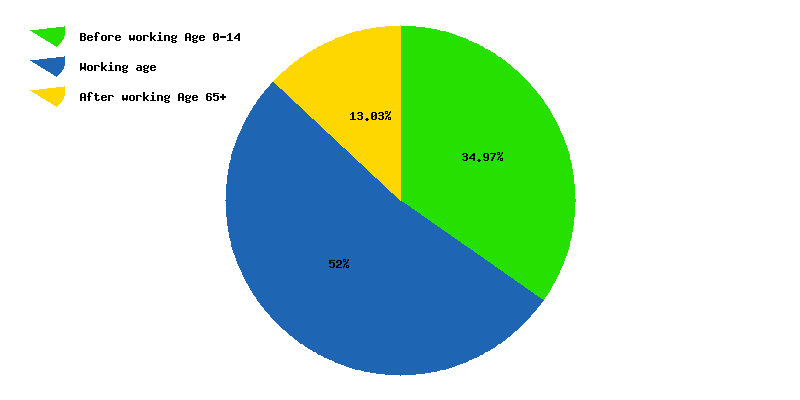
| 00-04 | 893,700 | 457,262 | 436,438 | 7.3 | 7.5 | 7 | 104.8 |
| 05-09 | 960,304 | 491,176 | 469,128 | 7.8 | 8.1 | 7.5 | 104.7 |
| 10-14 | 978,049 | 500,158 | 477,891 | 7.9 | 8.2 | 7.7 | 104.7 |
| 15-19 | 850,619 | 434,892 | 415,727 | 6.9 | 7.1 | 6.7 | 104.6 |
| 20-24 | 781,411 | 399,690 | 381,721 | 6.3 | 6.6 | 6.1 | 104.7 |
| 25-29 | 815,089 | 417,170 | 397,919 | 6.6 | 6.9 | 6.4 | 104.8 |
| 30-34 | 917,094 | 463,171 | 453,923 | 7.4 | 7.6 | 7.3 | 102 |
| 35-39 | 1,005,249 | 495,636 | 509,613 | 8.2 | 8.1 | 8.2 | 97.3 |
| 40-44 | 952,567 | 461,771 | 490,796 | 7.7 | 7.6 | 7.9 | 94.1 |
| 45-49 | 829,417 | 396,438 | 432,979 | 6.7 | 6.5 | 6.9 | 91.6 |
| 50-54 | 719,917 | 348,803 | 371,114 | 5.8 | 5.7 | 6 | 94 |
| 55-59 | 708,393 | 337,382 | 371,011 | 5.7 | 5.5 | 5.9 | 90.9 |
| 60-64 | 624,227 | 303,431 | 320,796 | 5.1 | 5 | 5.1 | 94.6 |
| 65-69 | 502,864 | 240,320 | 262,544 | 4.1 | 4 | 4.2 | 91.5 |
| 70-74 | 374,165 | 172,721 | 201,444 | 3 | 2.8 | 3.2 | 85.7 |
| 75-79 | 201,227 | 85,515 | 115,712 | 1.6 | 1.4 | 1.9 | 73.9 |
| 80-84 | 116,713 | 47,084 | 69,629 | 0.9 | 0.8 | 1.1 | 67.6 |
| 85-89 | 62,393 | 22,576 | 39,817 | 0.5 | 0.4 | 0.6 | 56.7 |
| 90-94 | 22,423 | 7,548 | 14,875 | 0.2 | 0.1 | 0.2 | 50.7 |
| 95-99 | 3,822 | 1,176 | 2,646 | 0 | 0 | 0 | 44.4 |
| 100+ | 464 | 115 | 349 | 0 | 0 | 0 | 33 |
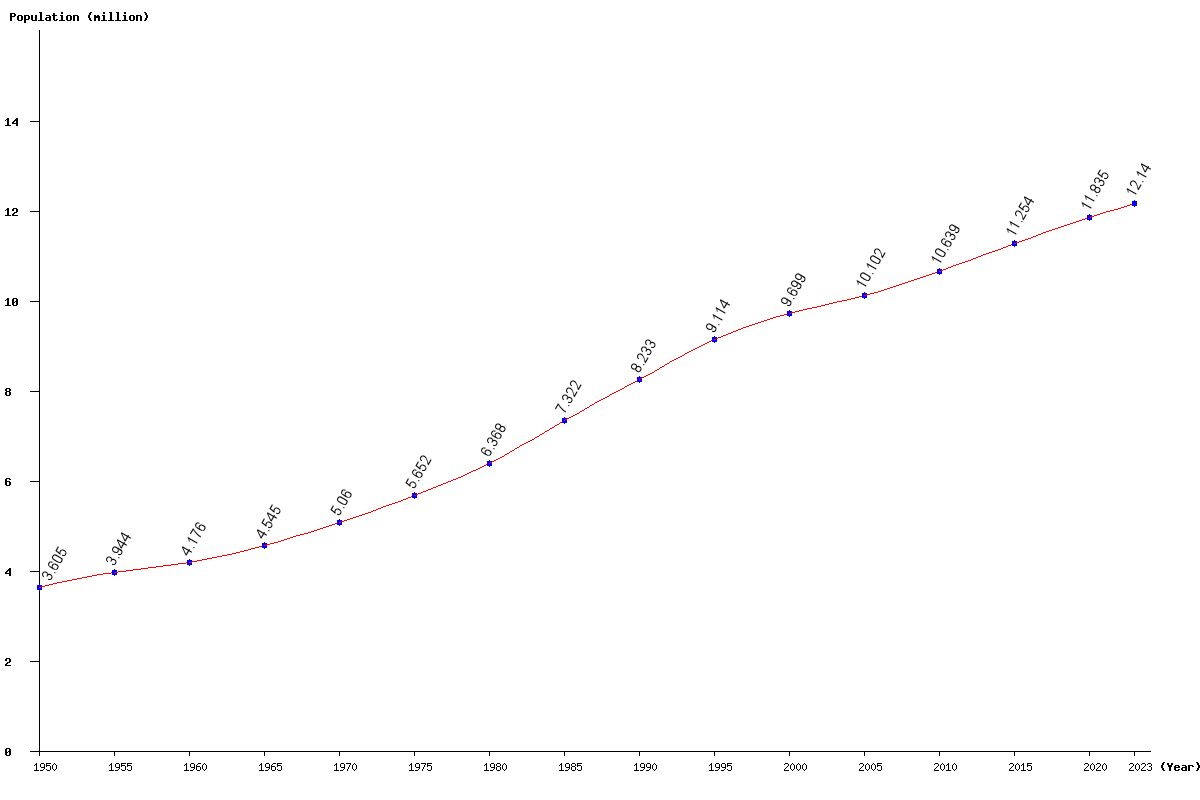
| Year | Population | Yearly % Change |
Yearly Change |
Sex ratio | Density (P/Km²) |
|---|---|---|---|---|---|
| 2025 | 12,320,107 | 0.72 | 87,537 | 97.56 | 79.30 |
| 2024 | 12,232,570 | 0.76 | 92,397 | 97.57 | 78.74 |
| 2023 | 12,140,173 | 0.81 | 97,145 | 97.59 | 78.14 |
| 2022 | 12,043,028 | 0.85 | 101,712 | 97.60 | 77.52 |
| 2021 | 11,941,316 | 0.90 | 106,032 | 97.61 | 76.86 |
| 2020 | 11,835,284 | 0.94 | 110,031 | 97.61 | 76.18 |
| 2019 | 11,725,253 | 0.98 | 113,651 | 97.61 | 75.47 |
| 2018 | 11,611,602 | 1.02 | 116,842 | 97.61 | 74.74 |
| 2017 | 11,494,760 | 1.05 | 119,540 | 97.61 | 73.99 |
| 2016 | 11,375,220 | 1.08 | 121,666 | 97.64 | 73.22 |
| 2015 | 11,253,554 | 1.11 | 123,400 | 97.69 | 72.44 |
| 2014 | 11,130,154 | 1.13 | 124,448 | 97.78 | 71.64 |
| 2013 | 11,005,706 | 1.14 | 124,256 | 97.90 | 70.84 |
| 2012 | 10,881,450 | 1.14 | 122,580 | 98.05 | 70.04 |
| 2011 | 10,758,870 | 1.12 | 119,676 | 98.21 | 69.25 |
| 2010 | 10,639,194 | 1.11 | 116,980 | 98.36 | 68.48 |
| 2005 | 10,102,477 | 4.16 | 403,285 | 99.22 | 65.03 |
| 2000 | 9,699,192 | 6.42 | 585,220 | 100.68 | 62.43 |
| 1995 | 9,113,972 | 10.70 | 881,175 | 101.45 | 58.66 |
| 1990 | 8,232,797 | 12.44 | 910,920 | 101.13 | 52.99 |
| 1985 | 7,321,877 | 14.98 | 953,708 | 100.78 | 47.13 |
| 1980 | 6,368,169 | 12.66 | 715,691 | 101.06 | 40.99 |
| 1975 | 5,652,478 | 11.70 | 592,085 | 101.13 | 36.38 |
| 1970 | 5,060,393 | 11.33 | 515,053 | 100.60 | 32.57 |
| 1965 | 4,545,340 | 8.84 | 369,074 | 100.87 | 29.26 |
| 1960 | 4,176,266 | 5.90 | 232,733 | 99.43 | 26.88 |
| 1955 | 3,943,533 | 9.38 | 338,223 | 99.05 | 25.38 |
| 1950 | 3,605,310 | 98.67 | 23.21 |