Swaziland population
143,543
Births this year: 0
Births today 0
Deaths this year 1,599
Deaths today 0
143,543
| Region Name | Percents | Number |
|---|---|---|
| Zionist (a blend of Christianity and indigenous ancestral worship) | 40% | 58,057 people |
| Roman Catholic | 20% | 29,028 people |
| Muslim | 10% | 14,514 people |
| other | 30% | 43,543 people |
| Ethnic groups Name | Percents | Number |
|---|---|---|
| African | 97% | 140,788 people |
| European | 3% | 4,354 people |
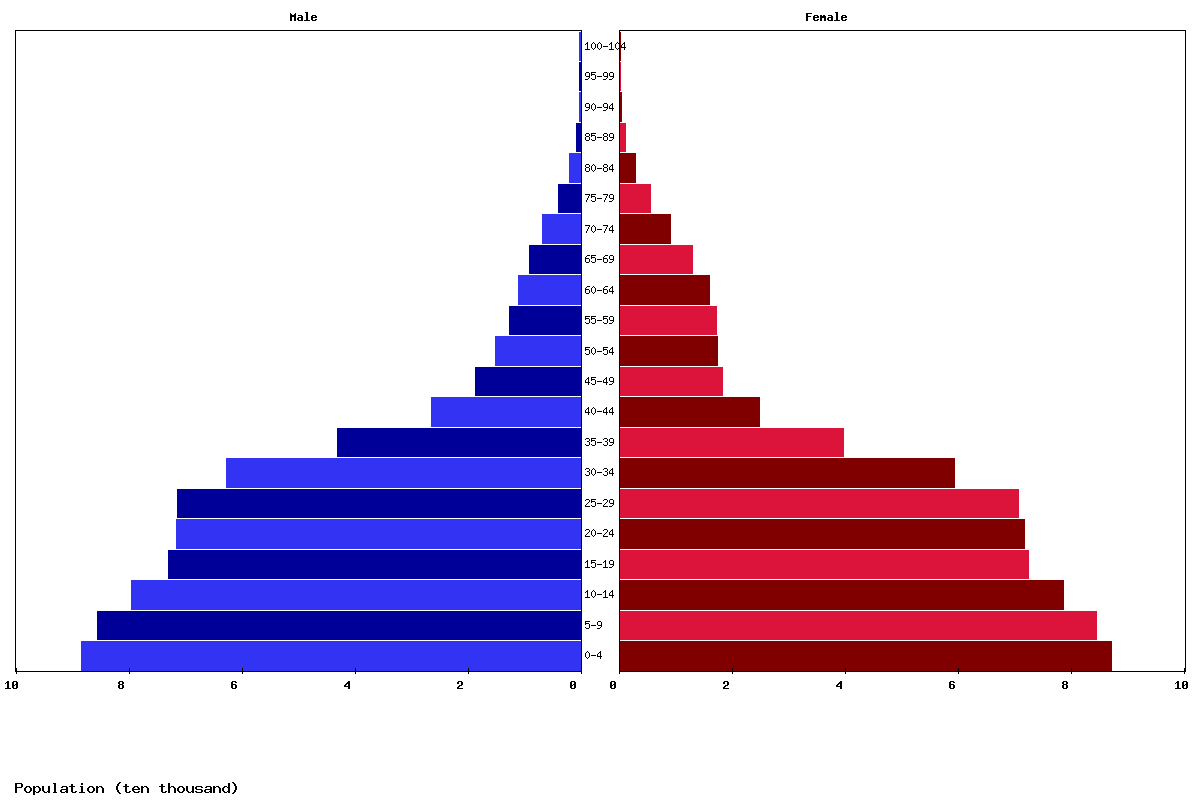
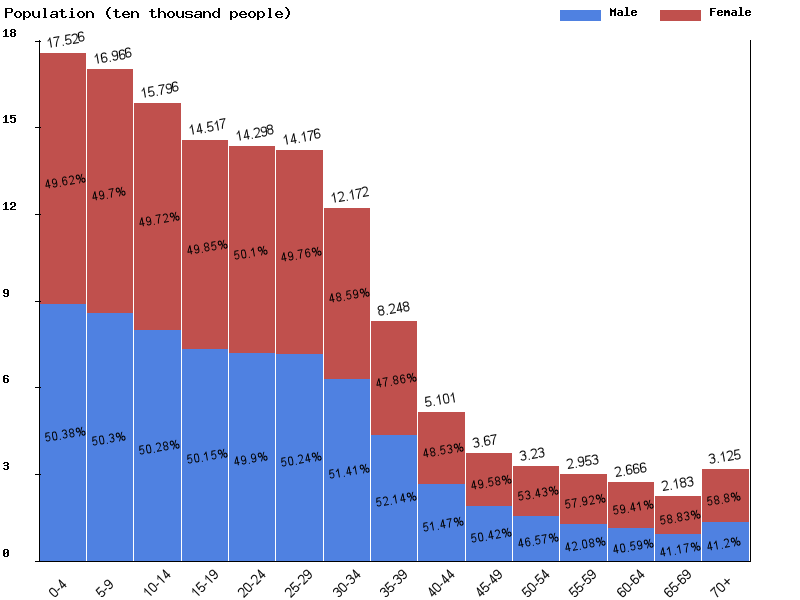
| Age | Both Sexes Population | Male Population | Female Population | Both Sexes (%) | Male (%) | Female (%) | Sex ratio (female/male) |
|---|---|---|---|---|---|---|---|
| Total | 1,438,414 | 717,608 | 720,806 | 100 | 100 | 100 | 99.6 |
| 00-04 | 171,442 | 86,370 | 85,072 | 11.9 | 12 | 11.8 | 101.5 |
| 05-09 | 172,144 | 86,582 | 85,562 | 12 | 12.1 | 11.9 | 101.2 |
| 10-14 | 168,237 | 84,557 | 83,680 | 11.7 | 11.8 | 11.6 | 101 |
| 15-19 | 155,672 | 78,032 | 77,640 | 10.8 | 10.9 | 10.8 | 100.5 |
| 20-24 | 140,864 | 70,122 | 70,742 | 9.8 | 9.8 | 9.8 | 99.1 |
| 25-29 | 135,777 | 67,405 | 68,372 | 9.4 | 9.4 | 9.5 | 98.6 |
| 30-34 | 130,687 | 66,171 | 64,516 | 9.1 | 9.2 | 9 | 102.6 |
| 35-39 | 107,814 | 56,519 | 51,295 | 7.5 | 7.9 | 7.1 | 110.2 |
| 40-44 | 70,077 | 37,458 | 32,619 | 4.9 | 5.2 | 4.5 | 114.8 |
| 45-49 | 42,305 | 22,290 | 20,015 | 2.9 | 3.1 | 2.8 | 111.4 |
| 50-54 | 30,635 | 15,583 | 15,052 | 2.1 | 2.2 | 2.1 | 103.5 |
| 55-59 | 27,745 | 12,712 | 15,033 | 1.9 | 1.8 | 2.1 | 84.6 |
| 60-64 | 25,902 | 10,523 | 15,379 | 1.8 | 1.5 | 2.1 | 68.4 |
| 65-69 | 22,982 | 8,976 | 14,006 | 1.6 | 1.3 | 1.9 | 64.1 |
| 70-74 | 17,581 | 6,962 | 10,619 | 1.2 | 1 | 1.5 | 65.6 |
| 75-79 | 10,870 | 4,399 | 6,471 | 0.8 | 0.6 | 0.9 | 68 |
| 80-84 | 5,237 | 2,056 | 3,181 | 0.4 | 0.3 | 0.4 | 64.6 |
| 85-89 | 1,941 | 724 | 1,217 | 0.1 | 0.1 | 0.2 | 59.5 |
| 90-94 | 439 | 147 | 292 | 0 | 0 | 0 | 50.3 |
| 95-99 | 59 | 19 | 40 | 0 | 0 | 0 | 47.5 |
| 100+ | 4 | 1 | 3 | 0 | 0 | 0 | 33.3 |
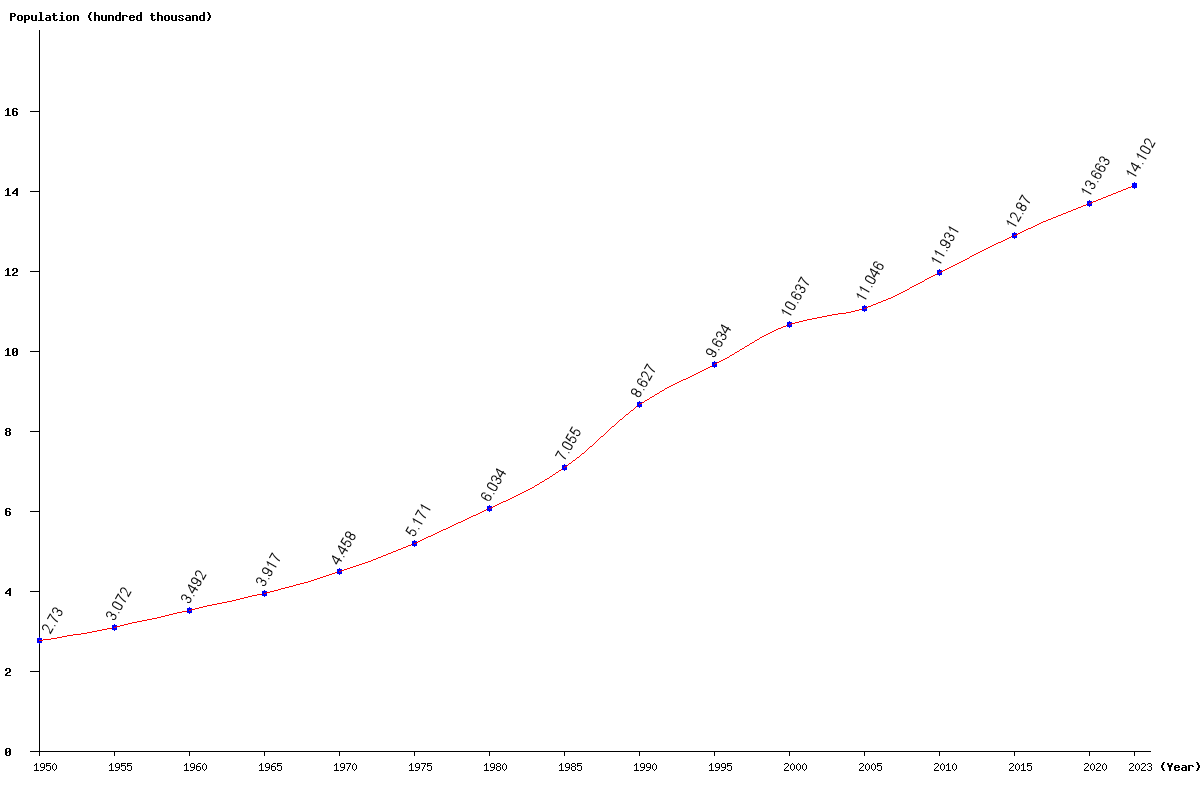
| Year | Population | Yearly % Change |
Yearly Change |
Sex ratio | Density (P/Km²) |
|---|---|---|---|---|---|
| 2025 | 1,438,414 | 0.98 | 14,006 | 99.56 | 83.63 |
| 2024 | 1,424,408 | 1.01 | 14,217 | 99.42 | 82.81 |
| 2023 | 1,410,191 | 1.03 | 14,432 | 99.27 | 81.99 |
| 2022 | 1,395,759 | 1.06 | 14,640 | 99.11 | 81.15 |
| 2021 | 1,381,119 | 1.09 | 14,853 | 98.95 | 80.30 |
| 2020 | 1,366,266 | 1.11 | 15,026 | 98.77 | 79.43 |
| 2019 | 1,351,240 | 1.14 | 15,241 | 98.60 | 78.56 |
| 2018 | 1,335,999 | 1.18 | 15,643 | 98.42 | 77.67 |
| 2017 | 1,320,356 | 1.25 | 16,293 | 98.23 | 76.76 |
| 2016 | 1,304,063 | 1.33 | 17,093 | 98.04 | 75.82 |
| 2015 | 1,286,970 | 1.41 | 17,858 | 97.83 | 74.82 |
| 2014 | 1,269,112 | 1.48 | 18,471 | 97.62 | 73.79 |
| 2013 | 1,250,641 | 1.54 | 18,947 | 97.38 | 72.71 |
| 2012 | 1,231,694 | 1.59 | 19,236 | 97.15 | 71.61 |
| 2011 | 1,212,458 | 1.62 | 19,310 | 96.91 | 70.49 |
| 2010 | 1,193,148 | 1.67 | 19,619 | 96.69 | 69.37 |
| 2005 | 1,104,642 | 3.85 | 40,927 | 95.60 | 64.22 |
| 2000 | 1,063,715 | 10.41 | 100,287 | 93.84 | 61.84 |
| 1995 | 963,428 | 11.67 | 100,700 | 92.64 | 56.01 |
| 1990 | 862,728 | 22.29 | 157,236 | 89.26 | 50.16 |
| 1985 | 705,492 | 16.92 | 102,119 | 89.45 | 41.02 |
| 1980 | 603,373 | 16.68 | 86,273 | 90.42 | 35.08 |
| 1975 | 517,100 | 15.98 | 71,256 | 90.48 | 30.06 |
| 1970 | 445,844 | 13.83 | 54,185 | 90.35 | 25.92 |
| 1965 | 391,659 | 12.15 | 42,426 | 91.42 | 22.77 |
| 1960 | 349,233 | 13.66 | 41,984 | 93.83 | 20.30 |
| 1955 | 307,249 | 12.55 | 34,249 | 93.91 | 17.86 |
| 1950 | 273,000 | 94.62 | 15.87 |